How to use NetPath on your Network with Network Performance Monitor
Mapping your network is very essential in order to keep track of your entire network. Most people use a network topology software to map their network which has its own set of features and benefits. Network maps are good and provide an overlook of the entire network, however, that can, sometimes, be not enough. When it comes down to a large network, monitoring it becomes harder as you will have to make sure that everything runs smoothly at all times. If we are to consider the standards of today’s digital world, network outages and performance issues are simply unacceptable especially if you are a big business with a lot of competition.
Therefore, optimizing your network devices and monitoring your advanced network is a top priority for network engineers. NetPath is a feature that comes with the Solarwinds Network Performance Monitor (download here) that lets you discover the node-by-node network path in real-time and provides in-depth network visibility via real-time information. This results in the network performance being monitored and subsequently, it segregates the connection or node that is causing network performance problems.
All in all, NetPath is a distinctive feature that helps network administrators as well as system administrators to identify network issues quickly by creating a map of the problematic area and thus ensures faster time to rectification. The tool that we are going to be using is called Network Performance Monitor by Solarwinds – a company that requires no introduction in the field of network and system management. Before we get into the real essence of the article and show you how to use NetPath, let us first have a look at how the feature actually works.
How does NetPath work?
NetPath makes use of distributed analysis and distributed monitoring to create a map for your network. NetPath is a step further into traceroute that gives you network insight on your critical network paths. The way it works is that you drop agents on your Windows computer that work like users. Now, these agents use advanced probing to discover the traffic on your network and the network path they use to reach a network’s endpoint devices, access points or destination nodes.
All of this data is then quantified and the performance of each node-to-node connection is calculated based on its defined performance metrics. NetPath also provides extra information and then, in the end, a clear map is shown that shows how your applications are being delivered to your users or your network traffic along with clear visibility of your entire network path.
Prerequisite:
Before proceeding with this guide, please make sure that you have deployed Solarwinds NPM in your network. NPM is an industry-favorite when it comes to network monitoring/management and we have a comprehensive NPM review that explains why.
If you do not have Network Performance Monitor deployed in your network, do not fret, we’ve got you covered. Head to the Monitor your Network Performance with NPM article that explains the installation procedure of the tool. Once you have followed through, you are ready to begin.
Creating a NetPath Service
To use NetPath on your network, you will have to first create a NetPath service in NPM. It is recommended that you create a service for the most important applications on your network that users depend on. A service is basically the mapped destination. These services are monitored by probes that are deployed by the Orion Platform automatically on each polling engine. Here’s how to create a NetPath service:
- Log in to the Orion web console.
- Move the cursor to the My Dashboard drop-down menu and then under the Network heading locate NetPath Services. Click on it to be taken to the NetPath Services tab.
- Once there, click the Create New Service button to start creating a new service.
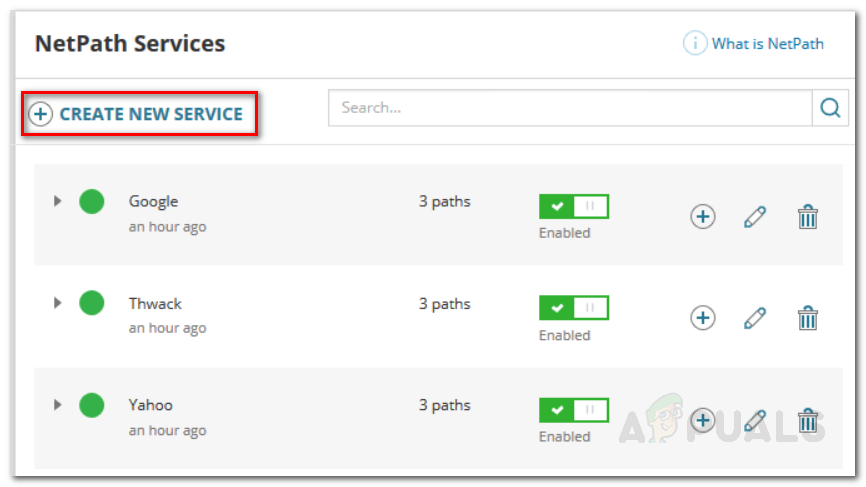
NetPath Services - Specify the service details of the target application of your network path. Make sure the service is TCP-based.
- Provide the hostname or the IP address followed by the port number. It is recommended that you use the same information that is used by the users to access the application. This means that if the users access the application via a hostname, specify a hostname and if they access the application via an IP address, provide an IP address. This will enable NetPath to get the same service as the users do.
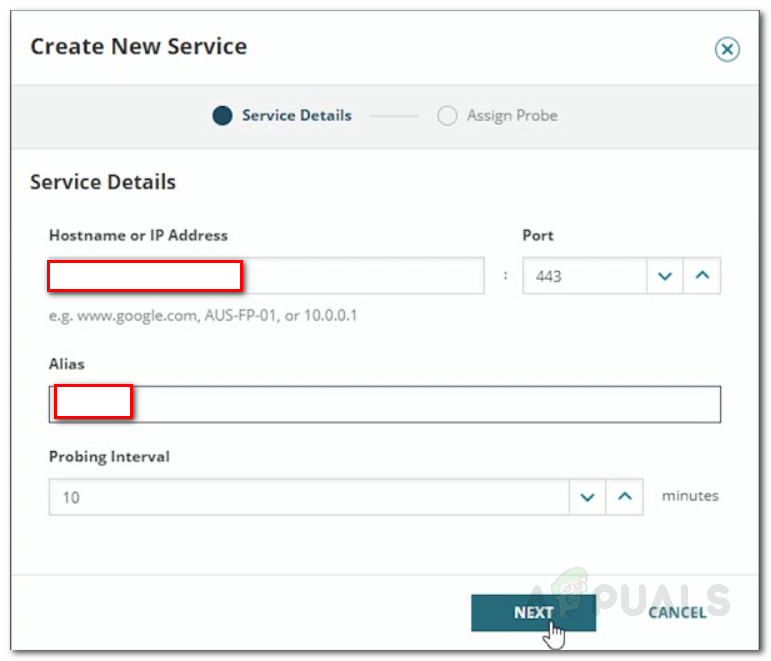
Creating New Service - After that, enter the probing interval in minutes. A minimum of 10 minutes of probing interval is recommended.
- Click Next to proceed.
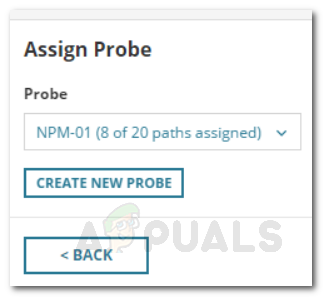
- Since the services are monitored by probes, select a probe from the list provided or you can create a new probe (discussed down below).
- Click the Create button to create the service.
Creating a NetPath Probe
As we have mentioned earlier, probes are used for monitoring services. Orion automatically installs a probe on each polling engine but you can create a NetPath probe yourself as well if you wish to. A probe is the starting path or the source you are testing the application from. You can think of it as a user representative. Something to note here is that a probe is always a Windows computer. It is recommended that you deploy probes where you have users. Here’s how to create a NetPath probe:
- Get to the NetPath services page via My Dashboards > Network > NetPath Services.
- To create a probe for a service, click the plus (+) icon in front of the service list.
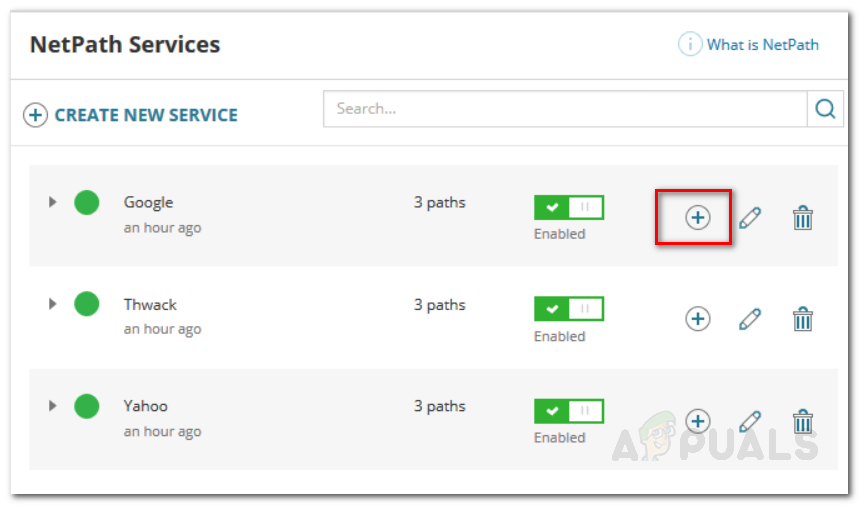
New Probe - After that, click on the Create New Probe option.
NetPath New Probe - Now, enter the information required on the Create New Probe window. This includes the credentials that are to be used to log into the computer and install the software.
- Once done, click the Create button to proceed.
- To assign the probe, select it from the list and then click the Assign button.
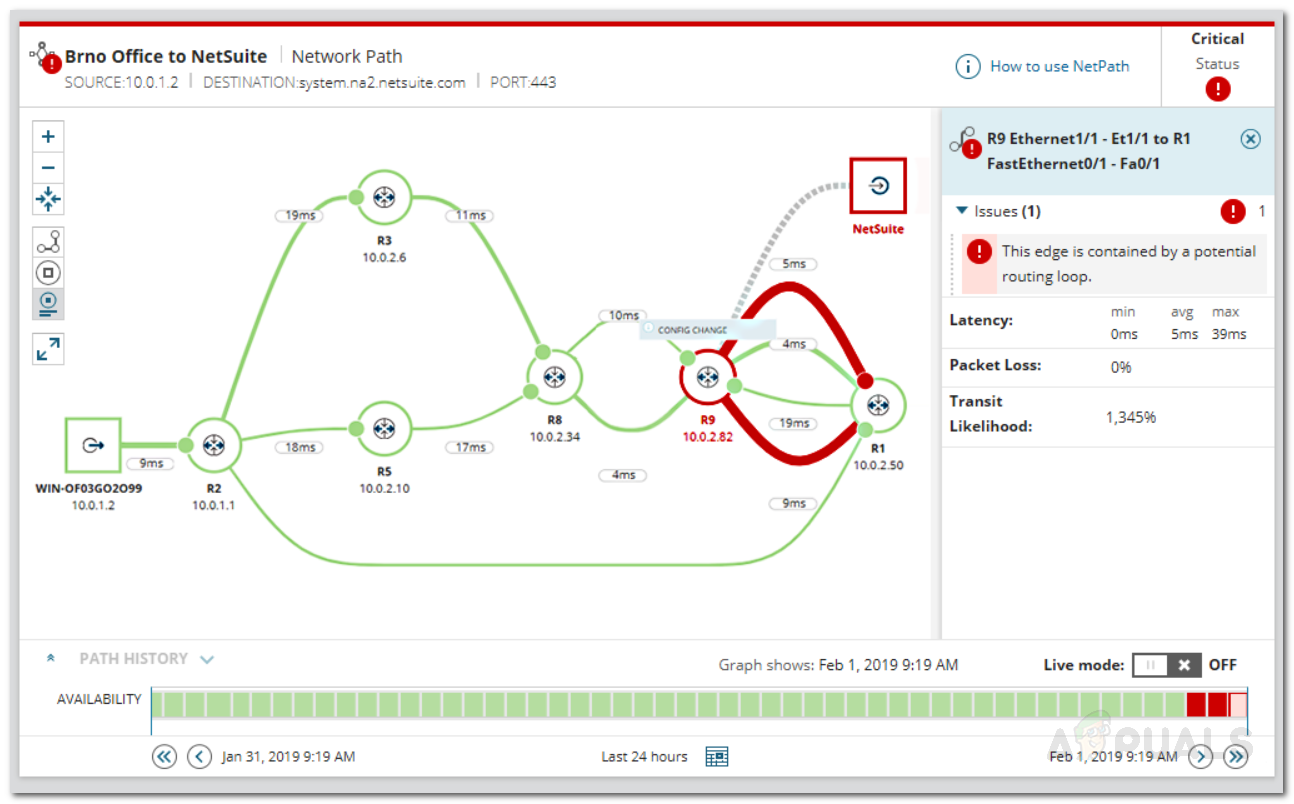
Viewing the Network Path
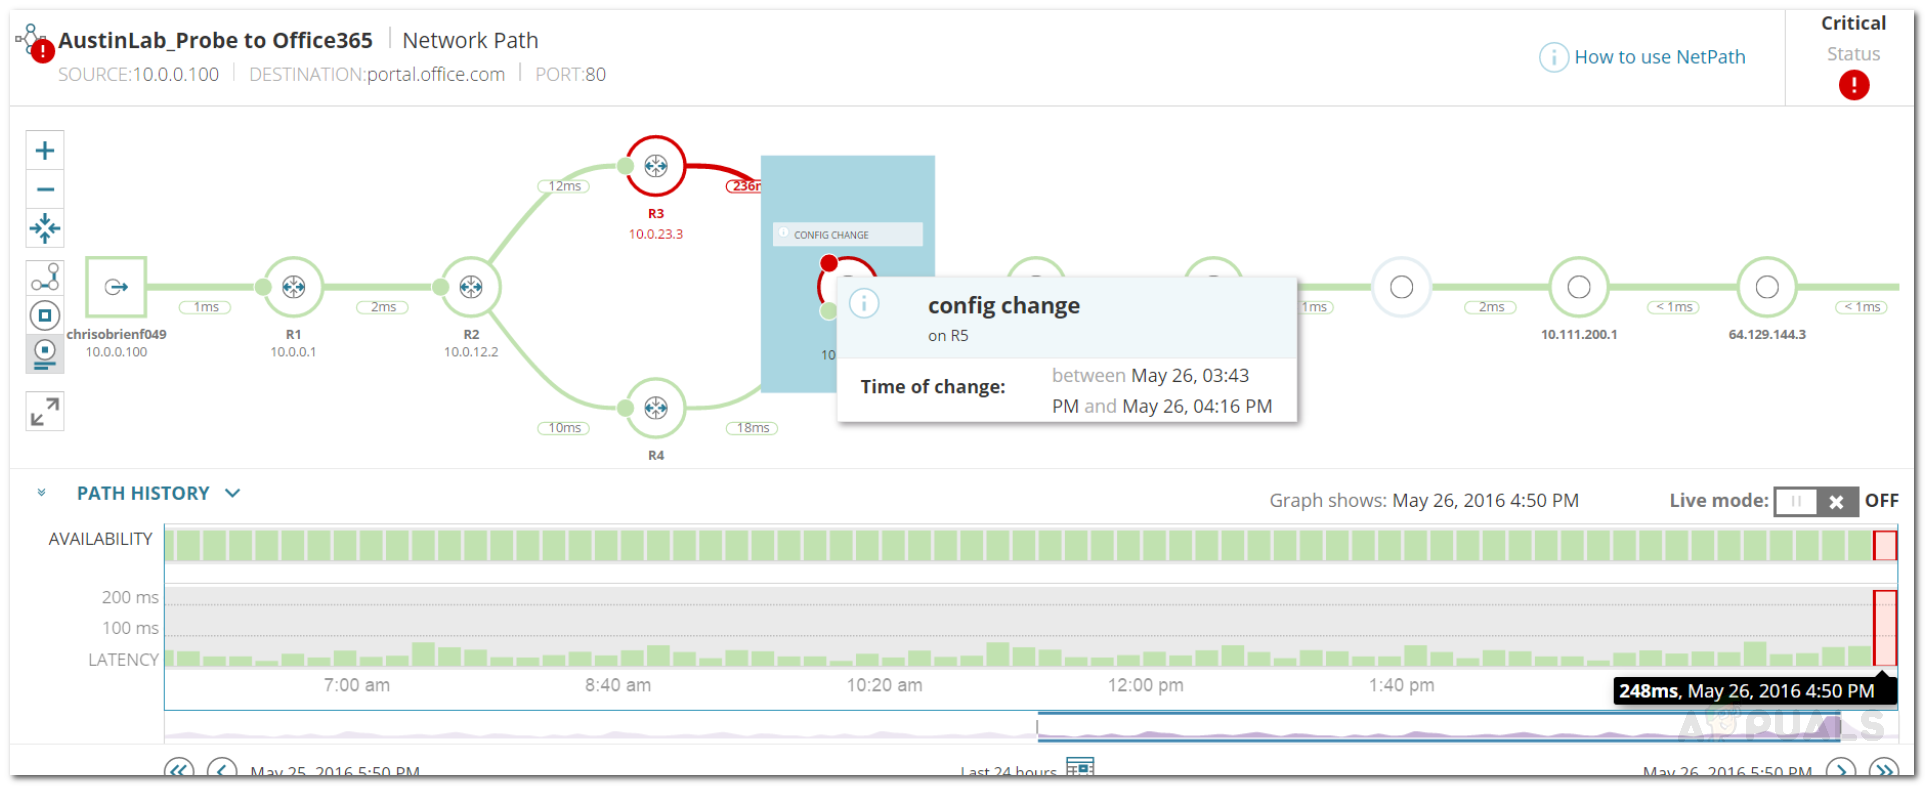
Now that you have deployed NPM in your network and successfully created a NetPath service, you can view your network path. The source is given on the left of the network path and the destination resides in the right. To check the network path, do the following:
- Click on My Dashboards > Network > NetPath Services. This will display all the network services that you have created.
- Choose a service from the list and then click on one of the assigned probes to view the network path from that source to the destination.
Viewing Network Path