SolarWinds Network Performance Monitor (NPM) – A Comprehensive Review
A healthy network is critical for business success. And this increased reliance on networks by businesses means that even the smallest network downtimes can have adverse effects on your business. So, it’s up to the network admins to ensure that they detect network problems and resolve them before they escalate. Which is not an easy task even for the most experienced pro. Well, unless you are using a dedicated Network Performance Monitor. See, most of the tasks that make life hard for network engineers can be automated through various networking tools. A lot of names pop to mind but in my opinion, the SolarWinds Network Performance Monitor is the cream.
We will be discussing the reasons for this as we proceed through the review but in a nutshell, this NPM is the perfect combination of feature set and affordability. The tool gives you complete visibility into your network including endpoints and servers and provides you with a central way to manage them. I don’t know about you but opening an individual SSH or Telnet session for every switch on my network is not how I want to spend my morning.
The SolarWinds NPM has been preconfigured to collect important performance metrics from your Network components, track the health status of these components, and also perform deep packet inspection and analysis. All of which will help to effectively reduce network downtime.
SolarWinds NPM offers Multi-Vendor Support
This tool leverages the SNMP, ICMP, and WMI protocols that come integrated into almost all networking devices to poll the performance data. So regardless of the underlying Operating System, you should be able to monitor all your hosts. Including those in your virtual environment. However, the NPM can only be installed in a Windows environment.

But what’s amazing is that even with all its features, this network monitor is really easy to use. Admittedly, it has not always been like that. SolarWinds did a complete overhaul of their interface in their latest version and now you just need a little intuition to navigate through the software. Although to be fair even the previous versions had an easier to use interface than most of the other NPM solutions.
Hey, I think am getting carried away and this is just the review introduction. Let’s back up and take this step by step.
Installation
The SolarWinds NPM can be installed using two methods. The first and recommended method is the online installation. Here you just need to download the 50MB online installer and the other components necessary to run NPM will be downloaded during installation. The advantage of this method is that you get the latest product optimizations and fixes and also, you only download what you need. Of course, the Orion server needs to have internet access for this to work.
The other method is offline installation which involves downloading a 2GB installer that has been prepackaged with the necessary files.
Moreover, SolarWinds NPM can be deployed in two modes. The first is the Lightweight installation which is perfect for evaluating the product or monitoring a small network. In this mode, the application server and the accompanying SQL database server are installed on the same server. This would not be viable in a production environment due to the unhealthy competition for hardware resources that would exist between Orion and SQL. Also, there is the fact that the database will have a 10GB storage limit. That is why we have the Standalone deployment method. Here, the NPM application server and the SQL database exist in different servers and it will be perfect for enterprise monitoring.
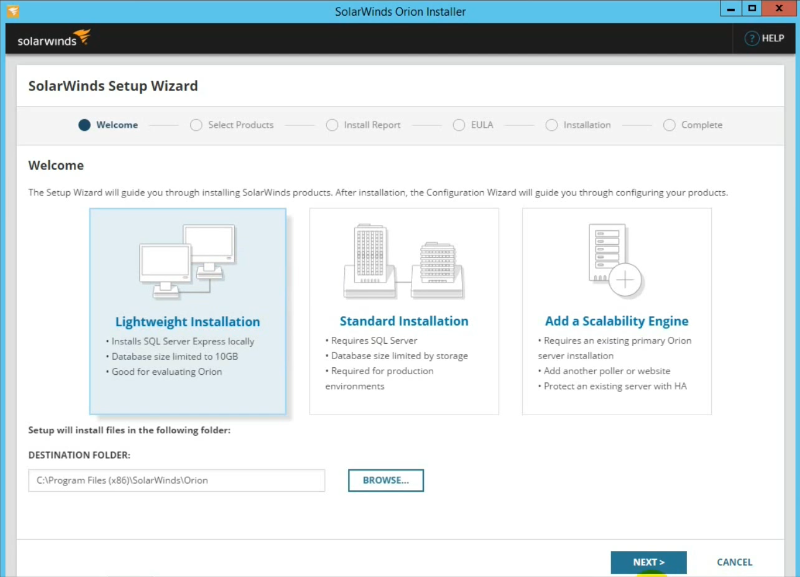
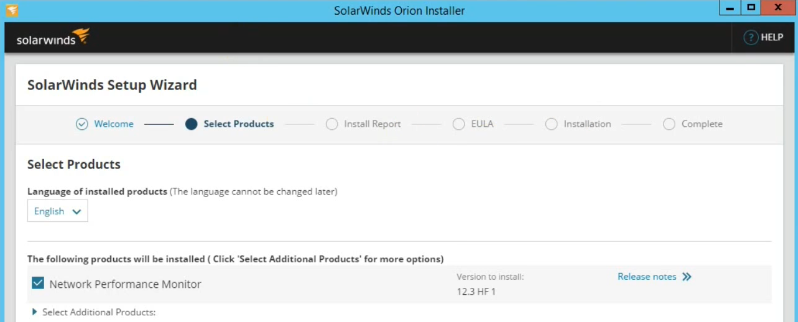
There is nothing overly complicated about the installation process and you should be done in less than 30 minutes. You can refer here for the full installation guide. Note that during installation, you will also be prompted to install additional monitoring solutions that are part of the SolarWinds Orion Platform. It’s my favorite thing about this NPM which I will be touching on it later in the review.
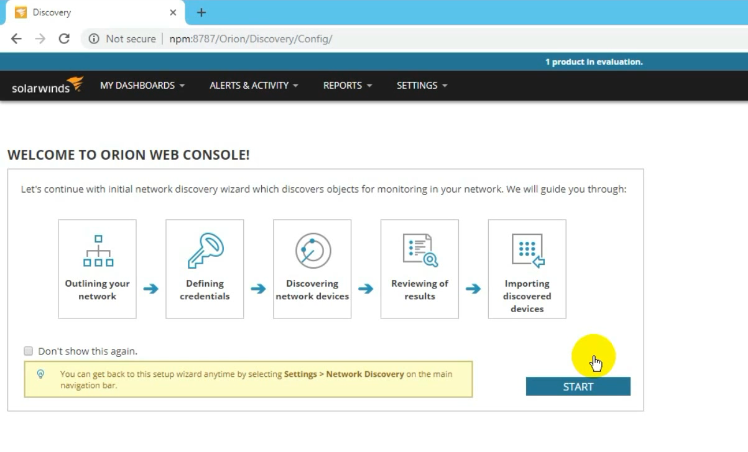
Once set up, the software will automatically launch its customizable web interface on your default browser so that you can finish setting it up. And that is the other thing I love about it. You can access it from virtually anywhere.
SolarWinds NPM Features Overview
Automatic discovery of network devices
One great thing about this software is that you don’t have to manually configure your network devices. It automatically scans and adds all the SNMP-enabled devices to the list of monitored devices. Although, if you just want to monitor specific hosts you can add them manually by specifying their IP address, subnet, or by querying the Active Directory Domain controller. The scanning process is continuous so when a device is added, removed or renamed, the changes will be updated promptly.
All the network devices are displayed on the tool’s homepage and you can get an overview of their performance by simply hovering the mouse over them. To get an in-depth view of the performance analysis then you simply click on a specific element.
Still, on the automatic discovery, this NPM incorporates a tool called Network Atlas that helps in creating a network topology map. This is great for identifying the relationship between different hosts and also helps in faster troubleshooting by providing a clear view of how data travels through the network.
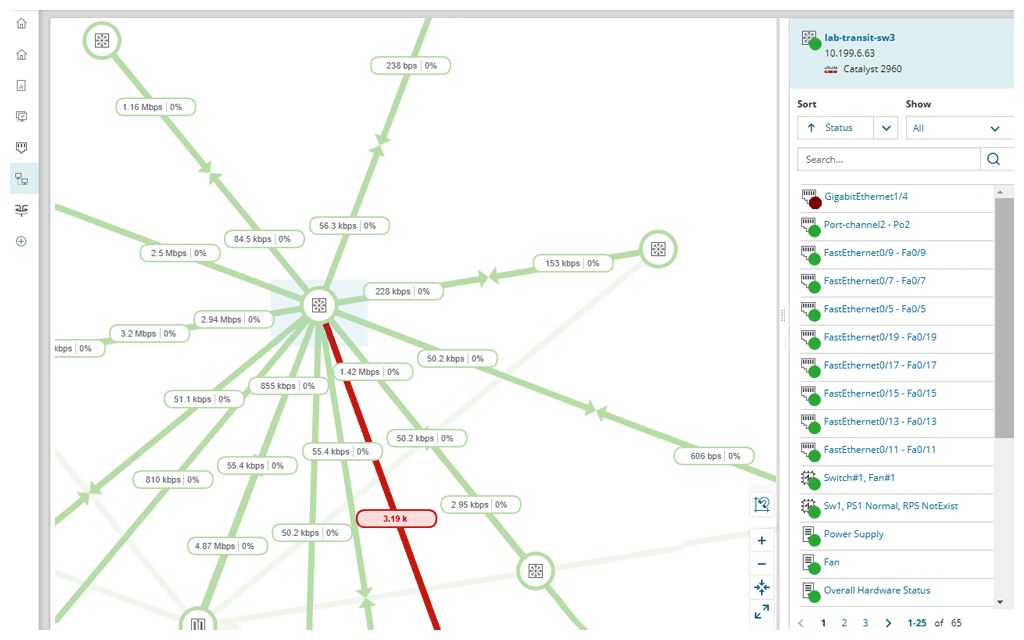
NPM has built-in map formats but also allows you to import custom images to enable you to display your network in different views. You can view it from a global perspective or on a device level. Even better you can import already existing maps, customize them and add them to the NPM dashboard using the Orion map widget.
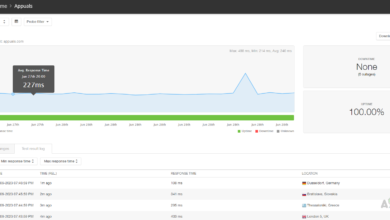
Performance Analysis
The performance data collected from your network components are displayed on individual dashboards on the NPM interface. And guess what? You don’t have to sit staring at the monitor all day long trying to identify anomalies. NPM already has preconfigured threshold conditions which it will compare the current data against. And when there is a deviation then it will send alerts allowing you to act on them. It also makes use of color-coding to represent the condition of various network components. Green means okay, Yellow means it needs attention, and Red indicates critical.
And that’s not all, the tool also creates graphical visualizations of the data so that it is easier to identify network issues. To make it even better you can drag and drop performance reports and place them side by side for easier comparison. This will be particularly useful when comparing a host’s historical data against current data. Or when you have two similar devices and one of them develops issues.
NetPath Analysis
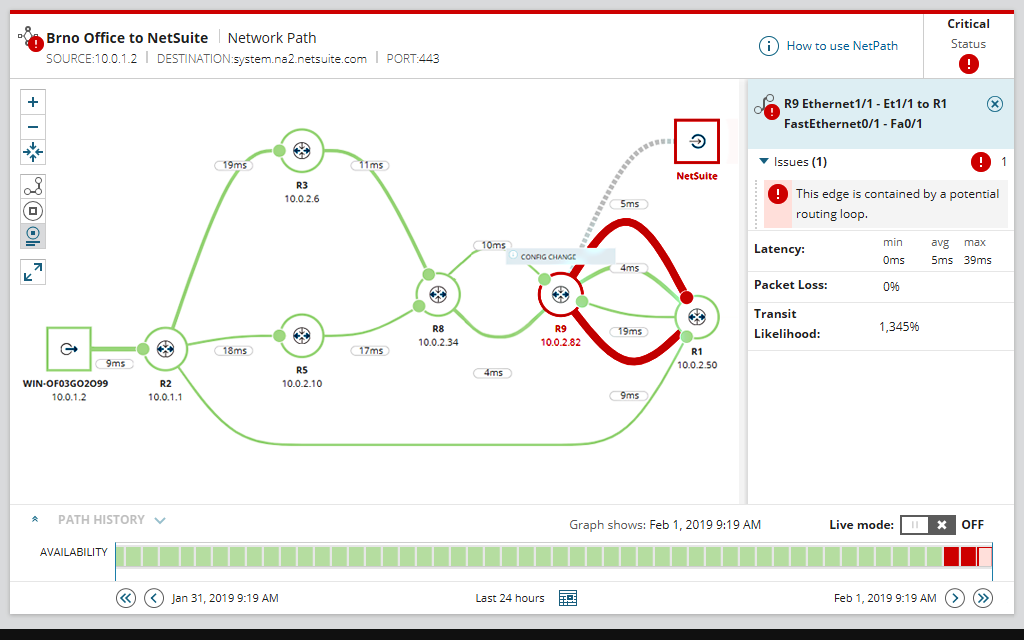
NetPath is another handy NPM feature that allows you to track the network data hop by hop. When this feature is combined with network topology map it gives you a real visualization of how the data is being transmitted which aids in faster troubleshooting. You can follow connections from the end-user to the services they are requesting and identify the factors in the path that are causing latency issues. NetPath can be used for on-premise, hybrid and cloud environments.
Alert Notifications
I have already mentioned the NPM’s automatic alerting capabilities but to expound on it, this tool supports multiple alerting methods. The first is through the alerts dashboard on the summary page of the software. Then other methods include SMS and email alerts.
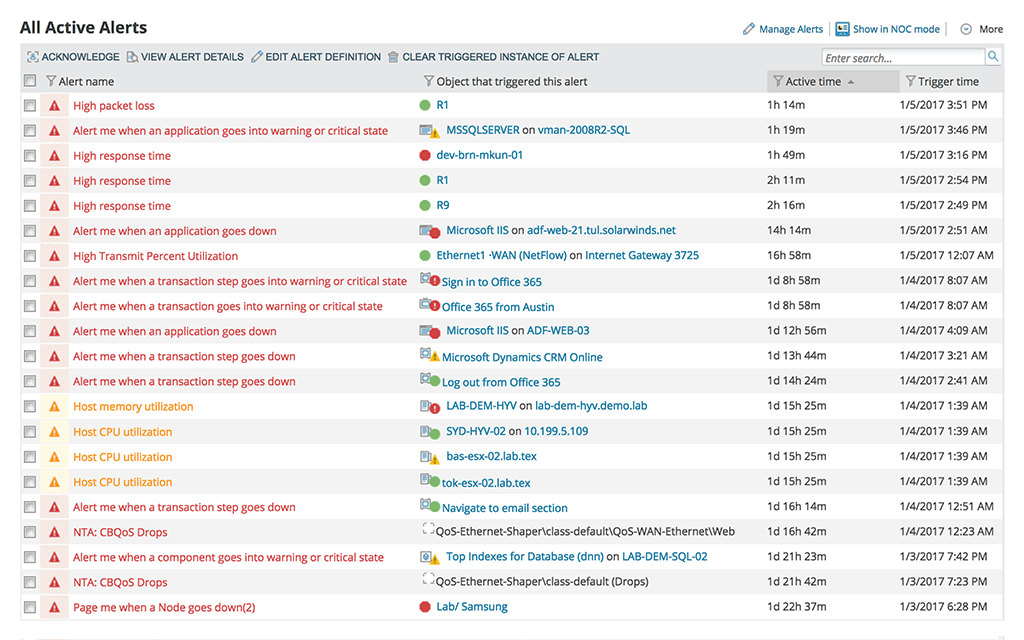
The baseline conditions for various components will be pre-set but you can also customize them to eliminate false alerts. More importantly, the SolarWinds NPM also allows you to establish a dependency between multiple events in the sense that if one of them occurs then no alert is triggered but if several of them occur then you receive a warning.
You can also configure the NPM to execute an external program when an alert is triggered which eliminates the need for you to be physically present to resolve a network issue. Awesome.
Apart from condition-based alerts which involve analyzing the key metrics and identifying deviation from normal performance, the SolarWinds NPM can also be used to receive SNMP traps. These refer to alert messages sent directly from the SNMP-enabled device and are indicative of issues such as device overheating.
Reporting
The SolarWinds NPM comes with an advanced reporting engine which together with the network reporting tools help you create comprehensive performance reports for your devices. The tool has several out-of-the-box report templates that you can use and also allows you to import custom reports that have been created by members of Thwack, SolarWind’s online community. You can even create your reports from scratch using SQL commands.

Speaking of which, does the idea of being in a community of like-minded people intrigue you? Because that’s what Thwack is. Here, you will network with other network admins as they share their experience with the NPM and various ways in which you can make the most use of it.
The reports created will be useful in several instances such as proving compliance to Service Level Agreements and predicting future network capacity needs by studying the current trends. They can also be presented to the management team when you want to communicate the performance situation of your business network.
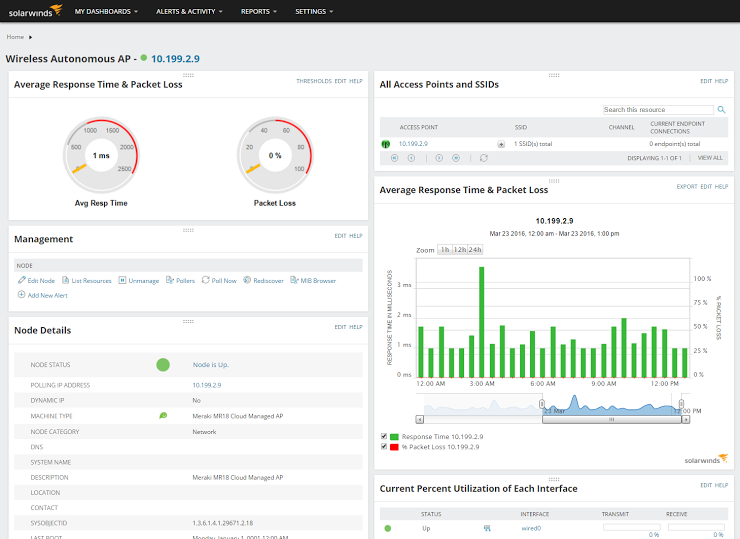
Wireless Monitoring
The SolarWinds Network Performance Monitor has an integrated Wireless Poller that automatically discovers wireless devices including those being managed from the cloud. Moreover, it gives you the device information such as the client name, IP and Mac address and an Rx/Rt summary. It also polls important key performance data such as bandwidth utilization, current node status, average response time, packet loss and network strength. All of which will be crucial in making decisions such as when to add new switches and Wi-Fi boosters. Or where to position your router for the best signal strength.
As if that’s not enough, the Wi-Fi analyzer tool also allows you to create reports for various aspects of your wireless hosts such as availability, average and peak number of clients, and also the identification of rogue access points over a certain period. The latter is a solid security feature that can prevent hackers from infiltrating your network. The wireless monitoring module also allows you to set alerts for the wireless hosts.
My Favourite Part – The SolarWinds Orion Platform
Imagine this, you get an alert notifying you that an application is taking too long to respond. How do you establish whether the problem is arising from your network, from the system or it’s a storage issue? I will tell you by having additional tools that are specific to these components like an application monitor or a storage resource monitor. Then, using these tools you can perform deeper performance analysis into your servers, applications, database, virtual machines and other components allowing you to quickly establish the source of the problem.
Now imagine having to open each of these programs individually to execute the troubleshooting. It is overwhelming. But in a genius move by SolarWinds, the tools can all be integrated into a single pane through the Orion platform to allow deep visibility into your entire IT stack. The Orion Platform is facilitated by the Perfstack module which allows you to drag and drop performance metrics from different sources in a chart overlay for easy comparison. So, whether it’s database wait data, network interface utilization, or the memory utilization of a VM host, you should be able to compare these data types side by side.
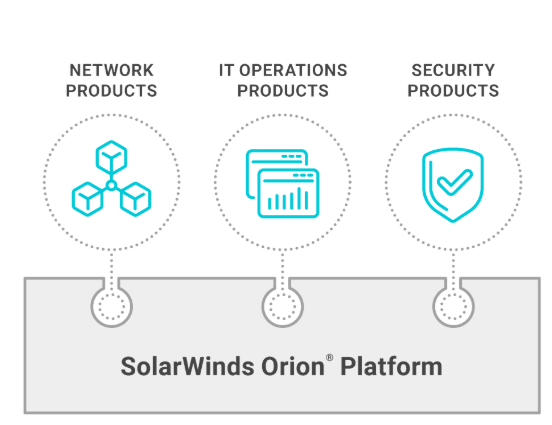
Some of the other software based on the Orion platform include the Server and Application Monitor, Database Performance Analyzer, Virtualization Manager, among others.
SolarWinds NPM Pricing
Unlike some of the other monitoring tools that use a feature-based subscription, the SolarWinds Network Performance Monitor is licensed based on the number of elements you will be monitoring. SolarWinds classifies your network components into three categories and the license you purchase will be determined by the category with the highest number of elements to be monitored.
The first category is Nodes which consist of components such as routers, switches, servers, and firewalls. The next category is the Interfaces which consist of switch ports, physical and virtual interfaces and any other single point of network traffic. And then there is the Volumes category which is composed of the logical disks in your Network. If you have a hard disk partitioned into C and D drives then that will count as two elements.
In most cases, it is the Interface classification that has the most elements. Although this is not surprising since each port counts as an element. And seeing as one switch can have as many as 48 ports then you can see how the number can quickly rise.
These are the 5 editions of the SolarWinds NPM you can purchase
- SL100 – Allows you to monitor up to 300 elements (100 nodes, 100 interfaces, 100 volumes).
- SL250 – Monitors up to 750 elements (250 nodes, 250 interfaces, 250 volumes).
- SL500 – Monitors up to 1500 elements (500 nodes, 500 interfaces, 00 volumes)
- SL2000 – Monitors up to 6000 elements(2,000 nodes, 2,000 interfaces, 2,000 volumes)
- SLX – Monitors networks with more than 2,000 nodes, interfaces, and volumes
To put it into perspective, if you are monitoring an environment with 500 nodes, 1600 interfaces, and 400 volumes, then the license to use would be SL2000 because it covers the category with the most elements. That is interfaces with 1600.
Establishing the number of elements in your environment should be easy enough since SolarWinds gives you a fully functional 30-day free trial of their network monitor. Once you perform the automatic discovery of your network hosts, you will have the information you need.
At the time of writing this, the lowest licensing tier starts at $2,955 annually. After the year is over you will need to pay a maintenance fee which will ensure you continue to receive support and product updates.
System Requirements
Operating System
The SolarWinds can only be installed on Windows Server 2016 and 2019. Unless you are installing it for evaluation purposes in which case you can set it up on Windows 10 Pro or Enterprise editions. It won’t work on the 32-bit versions.
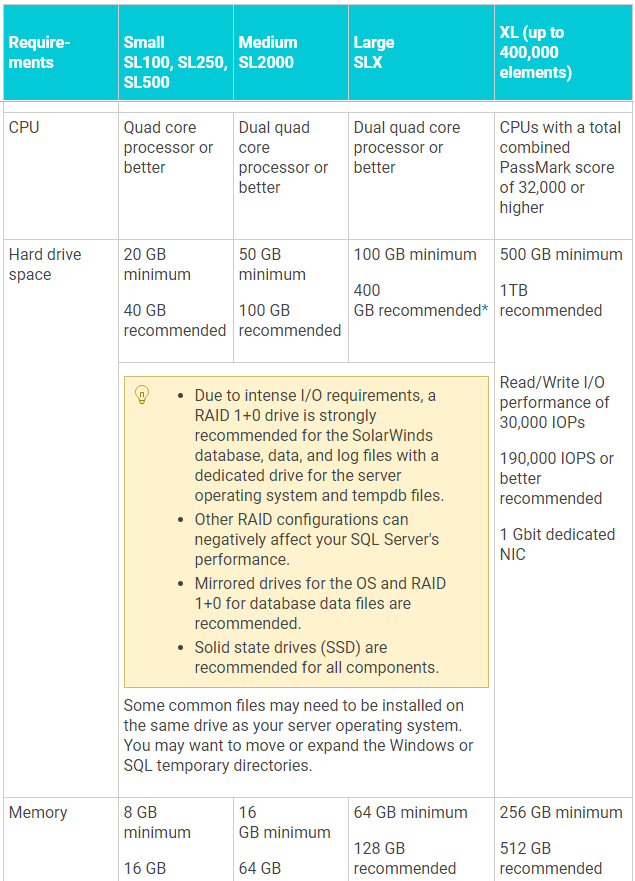
Hardware Requirements for the Application server
These will vary depending on the number of elements you are monitoring. Also, note that what I am giving you is the minimum recommendations and may vary depending on several factors. For instance, if you install additional Orion platform-tools on the same computer then you will need more hardware resources.

Server
The application server also needs to have at least 1GB Ethernet Network card. And if you are using a virtual server then the network card should not be used by any other virtual machine if you want optimum performance.
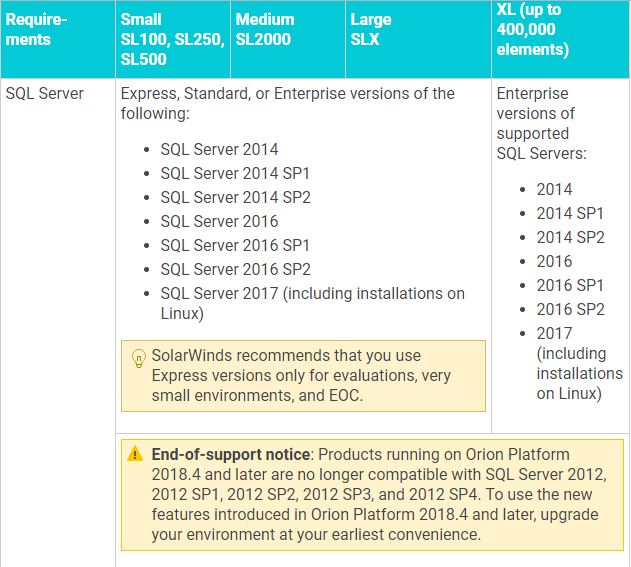
Hardware Requirements for the SQL Server
Again, the requirements will depend on the environment size you are monitoring. And remember that the application and database servers must be installed on separate servers. If you install the Orion server on your virtualization environment then the SQL server needs to be on a separate and physical server. Regarding the best database server, if you are using the Orion Platform 2018.2 you can use Amazon RDS while those using Orion Platform 2019.2 can use Microsoft Azure SQL.
Best Practices When Installing the Database Server
- Use the 64-bit of the SQL server
- Set the SQL Recovery model to SIMPLE recovery. This will help maintain the transaction log files at a manageable size.
- Ensure that the SQL server you choose supports Mixed-mode or SQL authentication
- The more RAM the better the performance
In case something is not clear, you can refer to this resource page for the full requirements including server port requirements.
The Downsides to Using SolarWinds NPM
I really don’t have much to say in this regard. I just experienced one problem which may not be an issue to everybody. When the NPM automatically discovers and adds a device to the list of all monitored devices, it also adds all the device’s nodes. And in some instances, there may e non-essential nodes that you don’t want to monitor. It would be great if they gave you an option to select the specific nodes you want to monitor once the device has been discovered.
Conclusion
The tasks of a Network admin are many. Network configuration and troubleshooting, monitoring of users and hosts, planning network expansion, just to name a few. The SolarWinds Performance Monitor is just the right automation tool that will take the hassle off these tasks and provide you with actionable data from which to base your decisions.
It will save you a lot of time that can be utilized in other productive activities. It’s also more effective and accurate than manual monitoring or any script you can conjure and is hence guaranteed to increase your network uptime. And then there is the holy grail. The ability to integrate the NPM with other solutions into a single platform.