Guide: Create Custom NetFlow Traffic View with Solarwinds
Creating a custom NetFlow traffic view in SolarWinds Network Traffic Analyzer (NTA) can help network administrators to better understand and analyze network traffic patterns. With a custom view, network administrators can easily view specific statistics about their entire network and its devices.
These filters provide a more efficient way to analyze network traffic, eliminating the need to navigate through the web console by single-device views. With the ability to view statistics in a more focused and targeted way, administrators can quickly identify and troubleshoot issues.
Custom filters in Flow Navigator within SolarWinds NTA offers a convenient and streamlined way to create a custom traffic view. To experience the capabilities of Flow Navigator in SolarWinds NTA, and to purchase the software, please click on this link.
Creating a Custom NetFlow Traffic View
Follow the below steps to create a custom NetFlow traffic view with Flow Navigator.
- Login into your Solarwinds NTA web console.
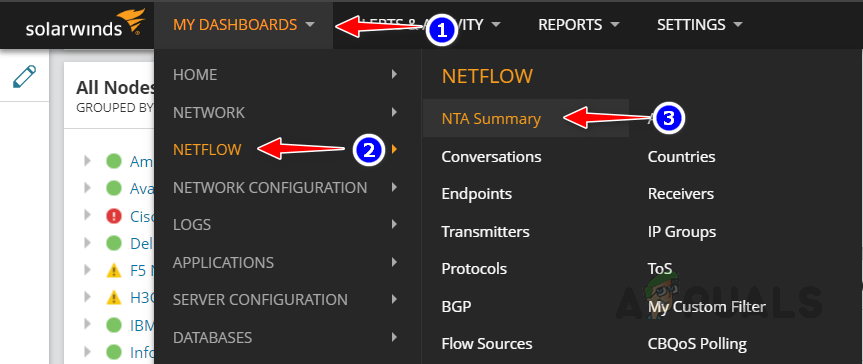
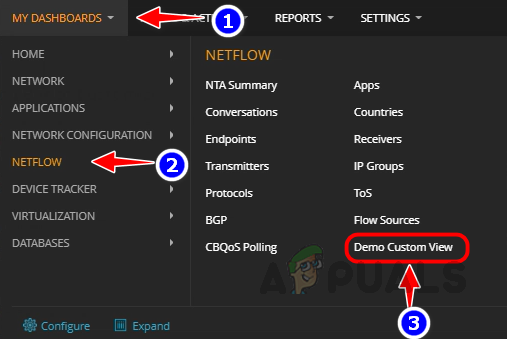
- Go to My Dashboards and then click on NTA Summary from the NetFlow sub-menu.
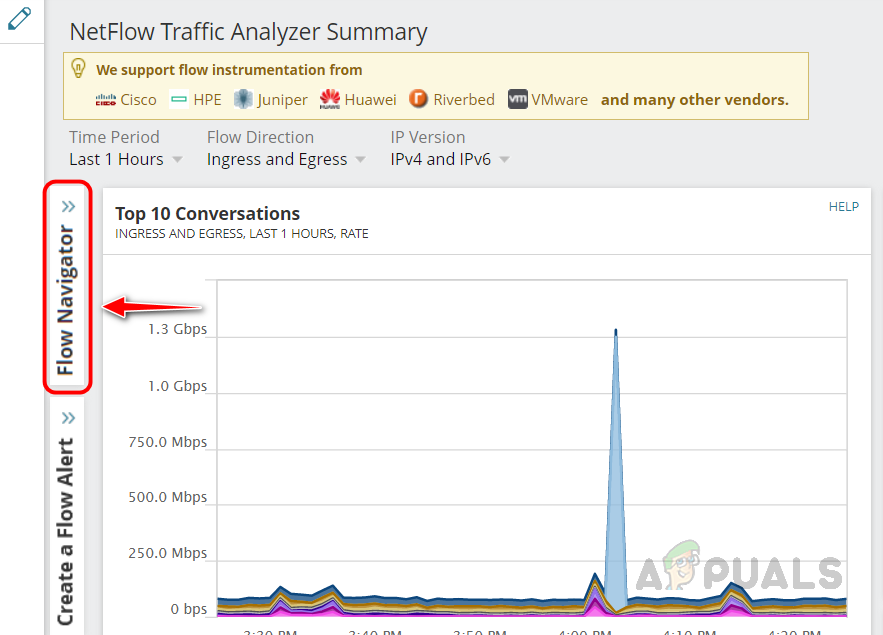
- Click on Flow Navigator from the left side pane.
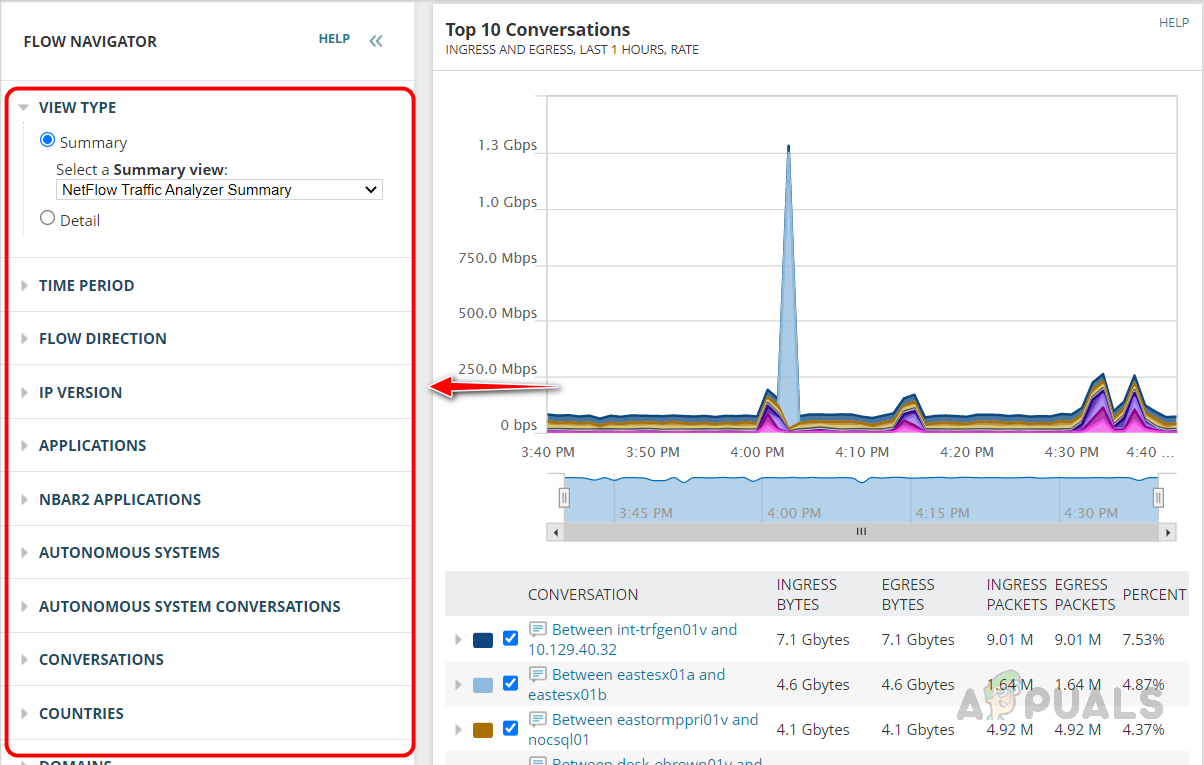
- These options can be used individually or in combination for even more precise analysis. Let’s explore each option in depth to gain a better understanding of how to create a custom view that meets your specific needs.
View Type
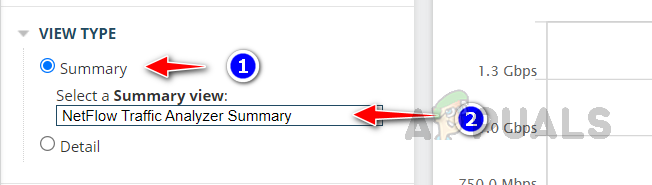
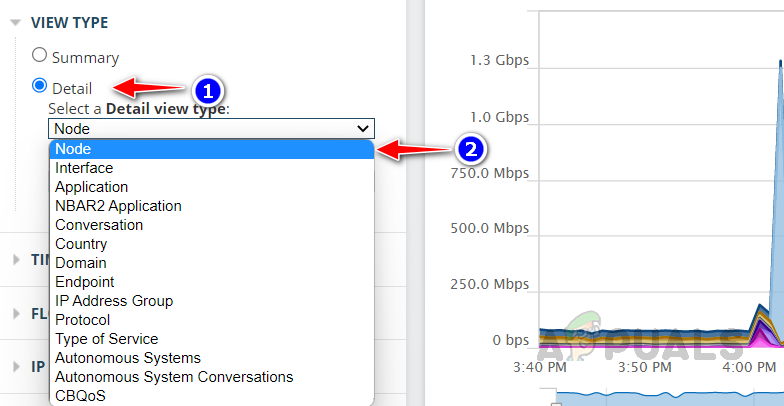
In the View Type, you can use either Summary or Detail. The Summary option allows you to filter your entire network and create a customized view, while the Detail option allows you to filter and create a customized view for a specific device or interface. This gives you the flexibility to view your network traffic in different levels of granularity, whether you want a broad overview or a more focused look at a particular device or interface. Let’s see how to use both options.
- To filter the entire network select Summary in View Type and then select NetFlow Traffic Analyzer Summary from the drop-down list.
- To choose a specific device or interface select Details in View Type and then select Node or Interface from the drop-down list.
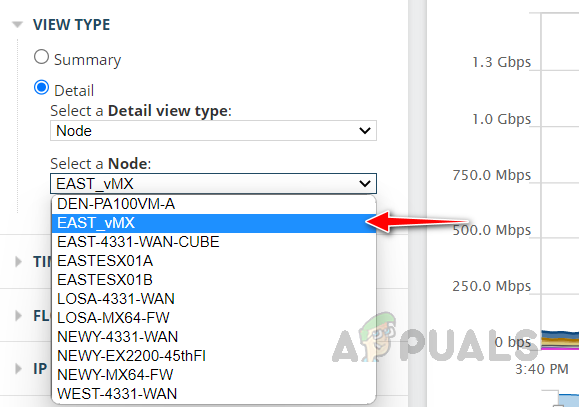
- Now, select the required node or interface for the custom view.
Time Period
The Time Period option allows for the customization of the time window for which network traffic is analyzed. Three options are available for selection: Named Time Period, Relative Time Period, and Absolute Time Period.
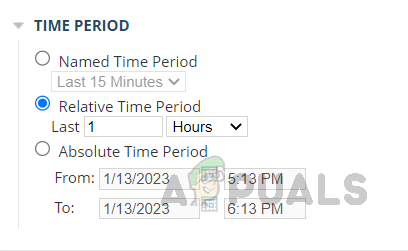
1. Named Time Period allows you to choose from pre-defined time frames.
2. Relative Time Period allows you to specify a time frame relative to the current time, measured in units of your choice.
3. Absolute Time Period allows you to select a specific start and end date and time.
By utilizing these options, you can easily tailor the time frame for your analysis to meet your specific needs and requirements.
Flow Direction
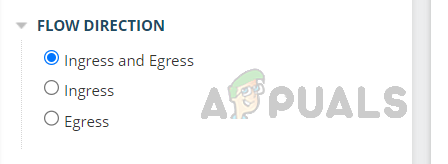
Select the preferred Flow Direction. We have options to choose both Ingress and Egress, only Ingress traffic or only Egress traffic.
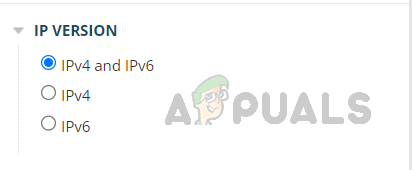
IP Version
In the IP Version, we can filter the traffic based on the preferred IP version. We have options to choose both IPv4 and IPv6, only IPv4 traffic or only IPv6 traffic.
Applications
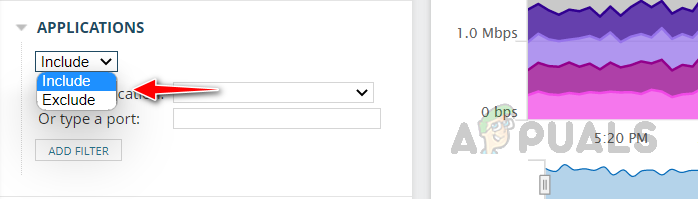
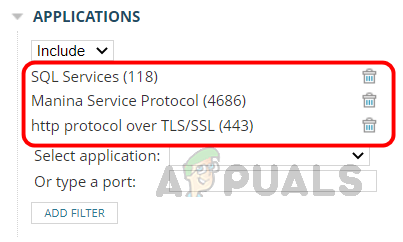
One of the options available when creating a custom view in SolarWinds NTA is the ability to limit the view to only display network traffic to and from specific applications or exclude traffic to and from them. This feature allows you to gain a deeper understanding of how different applications are impacting your network traffic. You can use this option to analyze the traffic data of a specific application or exclude the traffic data of an application that is not of interest to you. We can use the port number of the application as well to filter the traffic.
- Click on the drop-down list and select Include to display network traffic only from the selected application or select Exclude to avoid showing traffic data from that selected application.
- Click on the Select Application drop-down list and choose the preferred application and click on Add Filter.
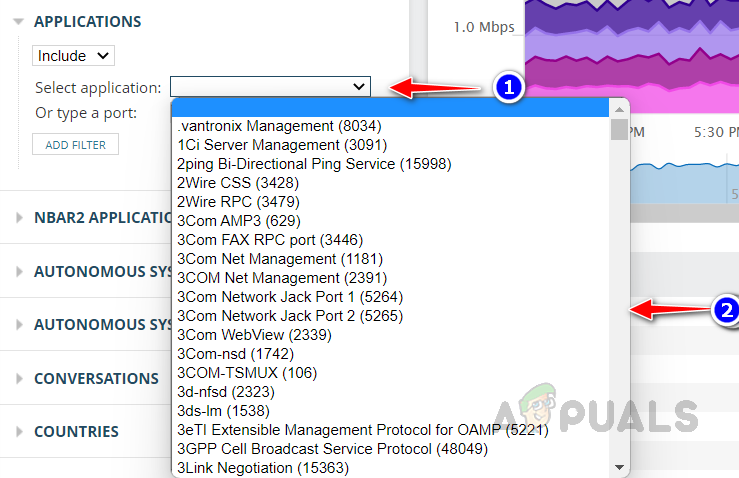
- You can add multiple applications to the filter.
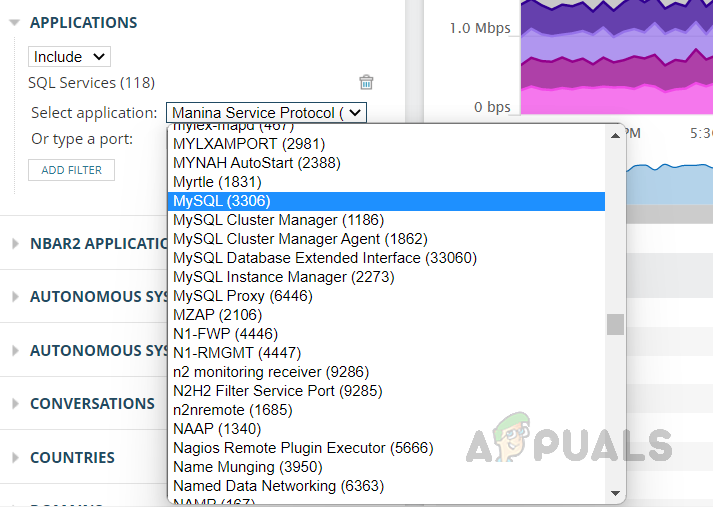
- Click on Add Filter after you selected each application to add the application to the view filter. You can use the port number as well to filter the application.
- Your selected applications will be listed here.
NBAR2 Applications
Solarwinds NTA monitors NBAR2 traffic, NBAR2 is an advanced application classification system that uses deep packet inspection technologies to provide detailed visibility into network traffic. It is able to identify and classify thousands of applications, regardless of port, protocol, or evasive technique used. This allows SolarWinds NTA to provide a more accurate and comprehensive view of network traffic data. It is important that the network device is capable of sending NBAR2 data and is properly configured to do so.
We have options to include or exclude the NBAR2 applications in the custom view. Select the applications and click on Add Filter.
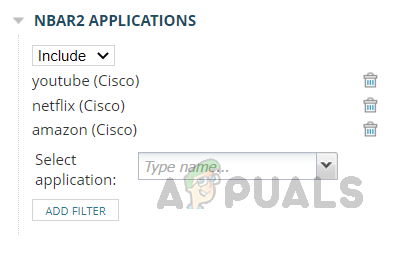 If your SolarWinds NTA is not receiving any NBAR2 data, the list of applications will be empty and the filter for monitoring NBAR2 traffic cannot be used.
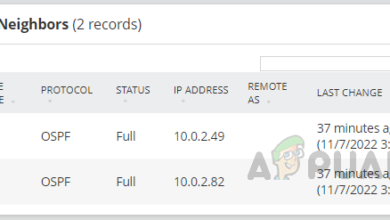
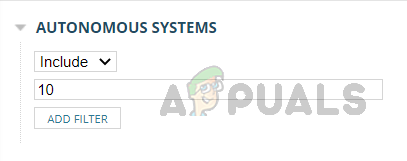
Autonomous Systems
With this option, we can include or exclude traffic from certain autonomous systems. Enter the autonomous system ID and click on Add Filter.
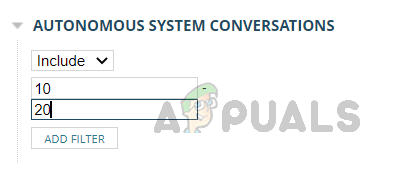
Autonomous Systems Conversations
We can use this option to include or exclude conversations between autonomous systems. Enter the autonomous system IDs of the appropriate network and click on Add Filter.
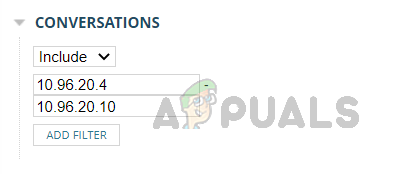
Conversations
This option allows limiting the view to only display network traffic related to specific conversations between two endpoints or exclude traffic to and from them. Enter the endpoint’s IP addresses and click on Add Filter.
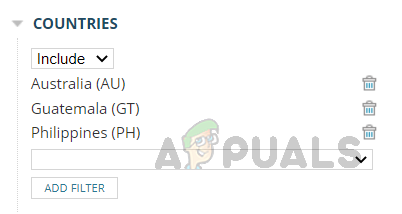
Countries
This option allows for the customization of network traffic analysis by country. This feature allows you to include or exclude traffic from specific countries. By including traffic from a specific country, you can focus on the traffic originating from that country. On the other hand, by excluding traffic from a specific country, you can eliminate unwanted traffic from your analysis.
Domains
This option allows us to filter traffic from the preferred domains, we can include or exclude the domains we want.
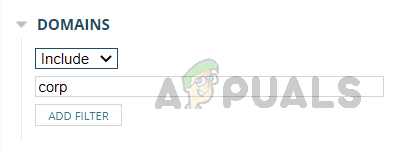
It’s important to note that domain names must be resolved and saved in NTA before they can be used. If a domain name is not resolved and saved, it cannot be used in the Flow Navigator and NTA will prompt you for a valid name.
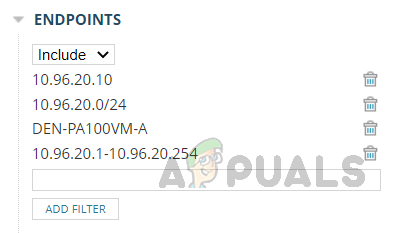
Endpoints
This option can be used to include or exclude traffic from certain endpoints. We can use IP address, hostname, subnet, IP range, and CIDR notation to filter traffic in this option.
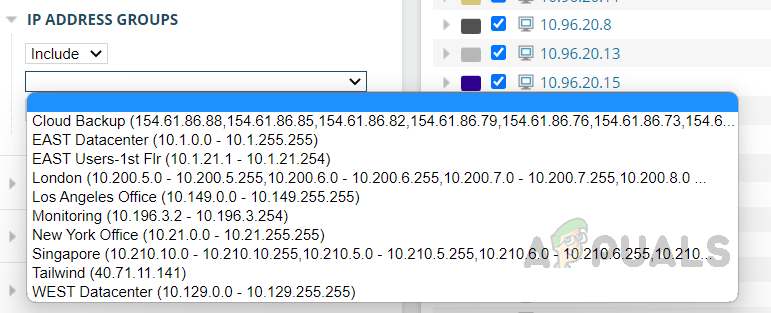
IP Address Groups
We can use this option to filter the traffic-related specific group. Enter the IP address group name that you want to include or exclude and click on Add Filter. IP address groups must be configured in NTA already.
Select the preferred IP address groups and click on add filter.
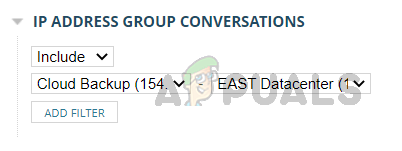
IP Address Group Conversations
This option can be used to filter conversations between certain IP address groups. Select the from and to IP address group that you want to include or exclude from the pre-configured list and click on Add Filter.
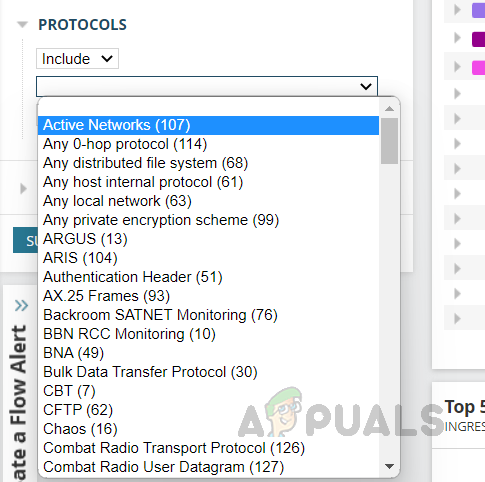
Protocols
Using this option we can include or exclude traffic details for certain protocols. Choose the preferred protocol from the list and click on Add Filter.
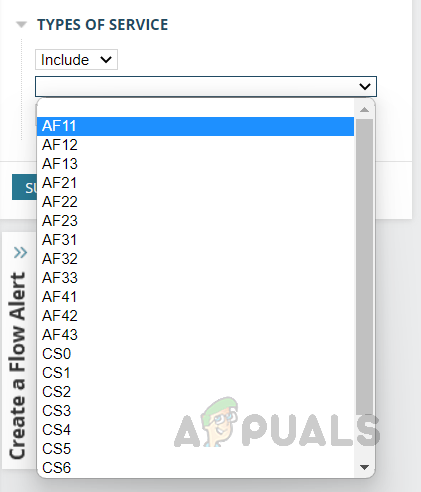
Types of Service
Using this option, we can filter the traffic based on the types of service. Select the service that you want to include or exclude from the list and click on Add Filter.
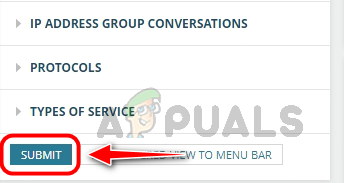
Now we have configured the filter options. As previously stated, the filter options can be utilized separately or in conjunction with one another. It is not necessary to configure all options, only the necessary ones need to be set. Now click on Submit to apply the filters.
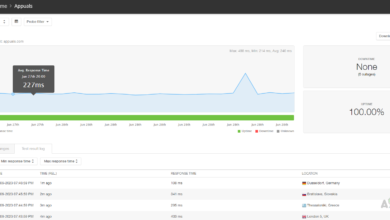
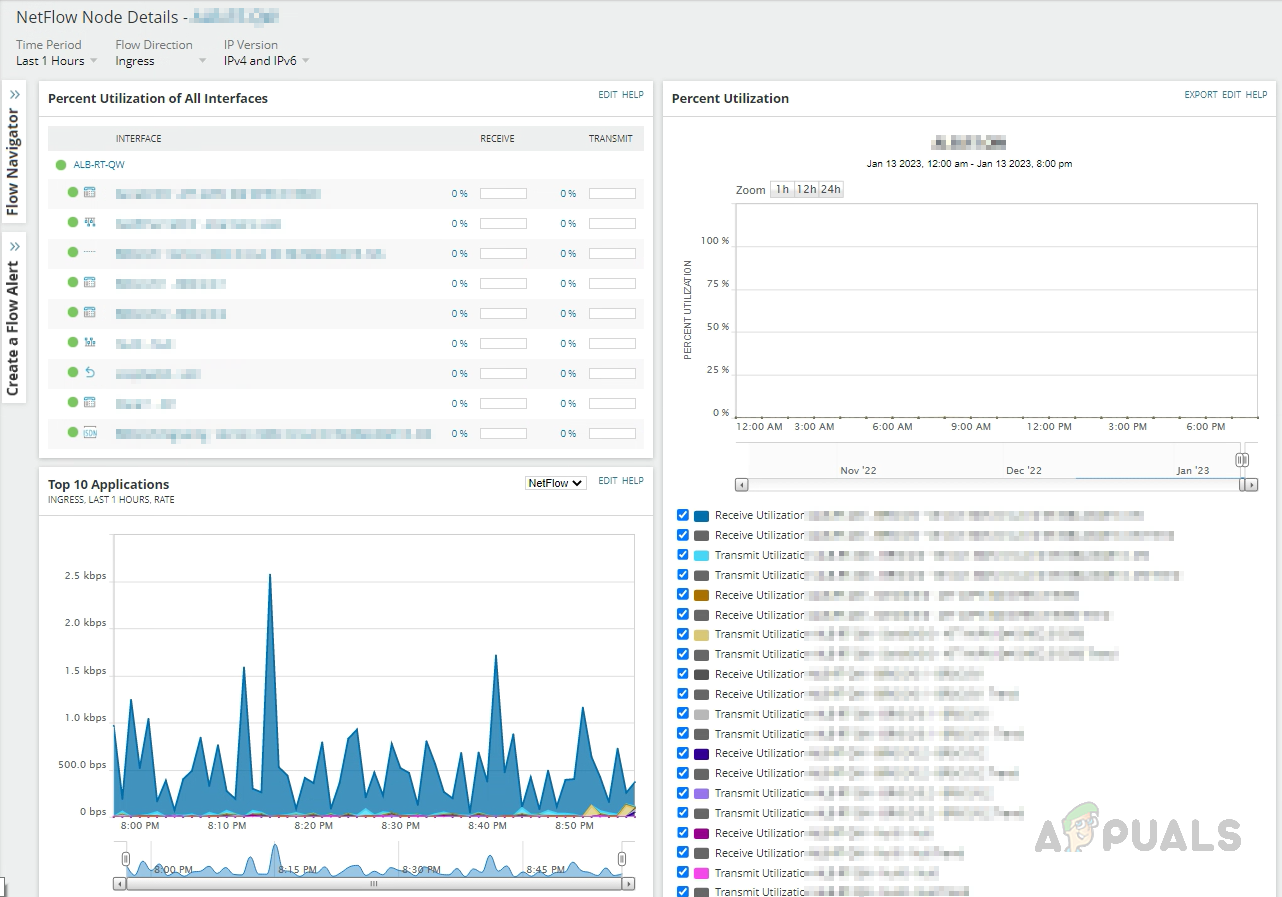
We can now see the traffic data based on the filter options we set.
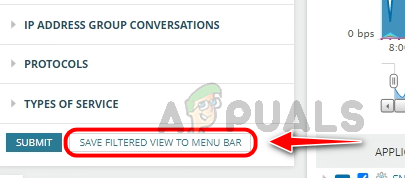
This custom view can be saved in the menu bar for easy access in the future, eliminating the need to set filters again. This allows administrators to create and save custom NetFlow traffic views for critical links, applications, endpoints, and other important areas of the network, making it easy to monitor and troubleshoot issues as they arise.
To save the view click on Save Filtered View To Menu Bar.
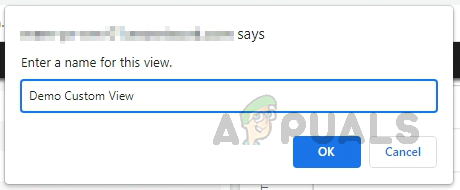
Solarwinds will ask for a name to save this view, provide an appropriate name and click on ok to save the custom view.
Once the view is saved, you will get a success message. To access the saved custom view, go to My Dashboards and click on the custom view created from the NetFlow sub-menu. All the saved custom NetFlow traffic views will be saved in the NetFlow sub-menu.
This is how we can create a custom NetFlow traffic view using Flow Navigator. With a custom view, network administrators can easily view specific statistics about their entire network and its devices by eliminating the need to navigate through the web console by single-device views. This allows for more efficient monitoring and troubleshooting, making it easier to identify and resolve potential issues.