How to Identify and Fix High Bandwidth Utilization on the Network?
A good network speed is measured by how fast we get responses from a website and download data from the internet. To achieve this, we need better bandwidth, and the network bandwidth usage should not be overutilized. Keeping the bandwidth underutilized is a significant task for a network administrator’s day-to-day life.
In older times, finding the cause for high bandwidth utilization was like finding a needle in a haystack, but in this digital era, there are a wide variety of tools available to monitor high bandwidth utilization and the cause. On those tools, Solarwinds NTA is standing apart from the crowd. Here, we will see what Solarwinds NTA is and how to use it to monitor and identify the root cause of high bandwidth utilization.
What is Solarwinds NTA?
Solarwinds NetFlow Traffic Analyzer is a NetFlow Analyzer and Bandwidth monitoring tool. NetFlow gives insights into the complete traffic with that we can monitor who or what is consuming the bandwidth to reduce the bandwidth usage. You can learn more about NTA and download the product from this link.
NetFlow is cisco developed protocol to monitor traffic flow on their devices in a network. With this Netflow data, we can get the complete picture of traffic flow on the network. Other vendor has their own flow protocol; you can check the vendor documentation to know which protocol is used by non-Cisco devices.
Also, NTA supports other flow protocols like NetFlow, J-Flow, sFlow, etc. To know more about the supported protocols and their versions by Solarwinds NTA click on this link.
Monitoring Bandwidth Utilization and NetFlow Data
To monitor bandwidth utilization and NetFlow data using NTA, first, we need to add the node and respective interface to monitoring. Also, we need to enable NetFlow on the interface (protocol may vary based on the device vendor).
Adding Node and Interface to Monitoring
- Open your Solarwinds NTA webconsole on your preferred browser and login into the console.
- Hover your mouse over Settings and click on All Settings.
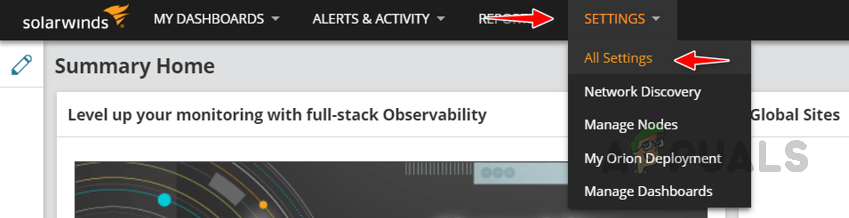
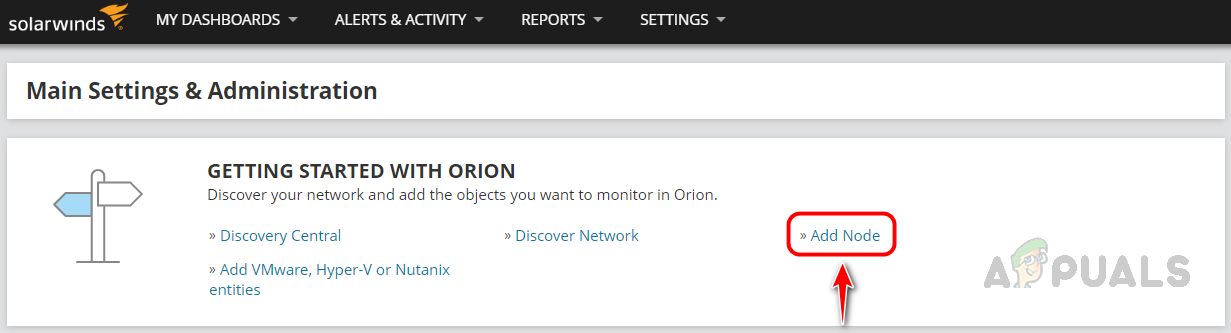
- Click on Add Node under Getting Started With Orion.
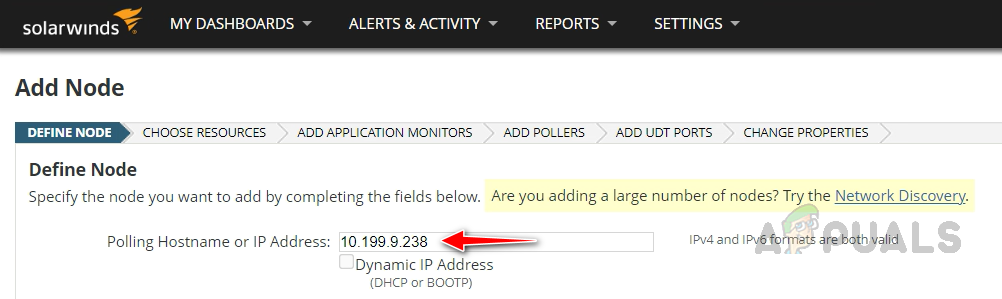
- On the Add Node page, provide the IP Address of the device that you want to add to monitoring.
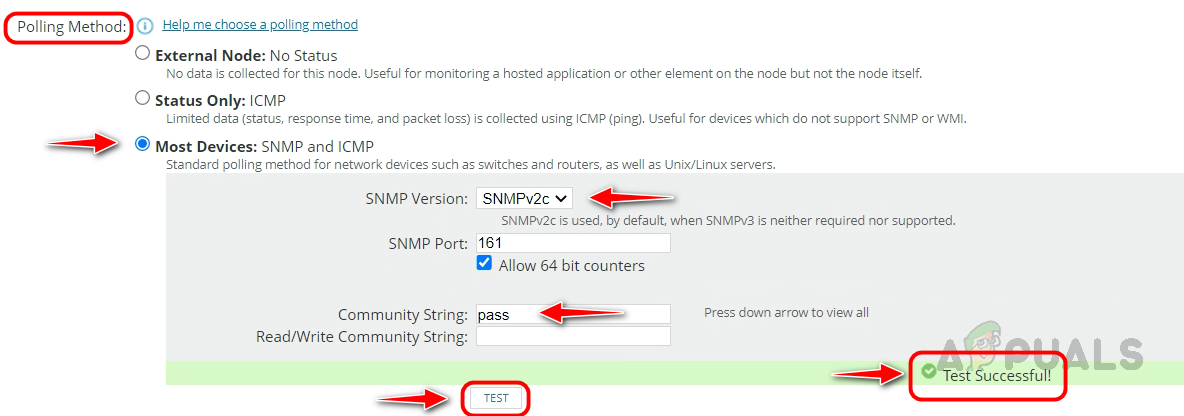
- In Polling Method, choose Most Devices: SNMP and ICMP and select your preferred SNMP version. Here, I am choosing SNMP v2 since I configured my network device using SNMP v2. Provide the Community String and click on Test to validate whether Solarwinds can communicate with the device using SNMP. The test result should be successful to proceed further.
- Click on Next.
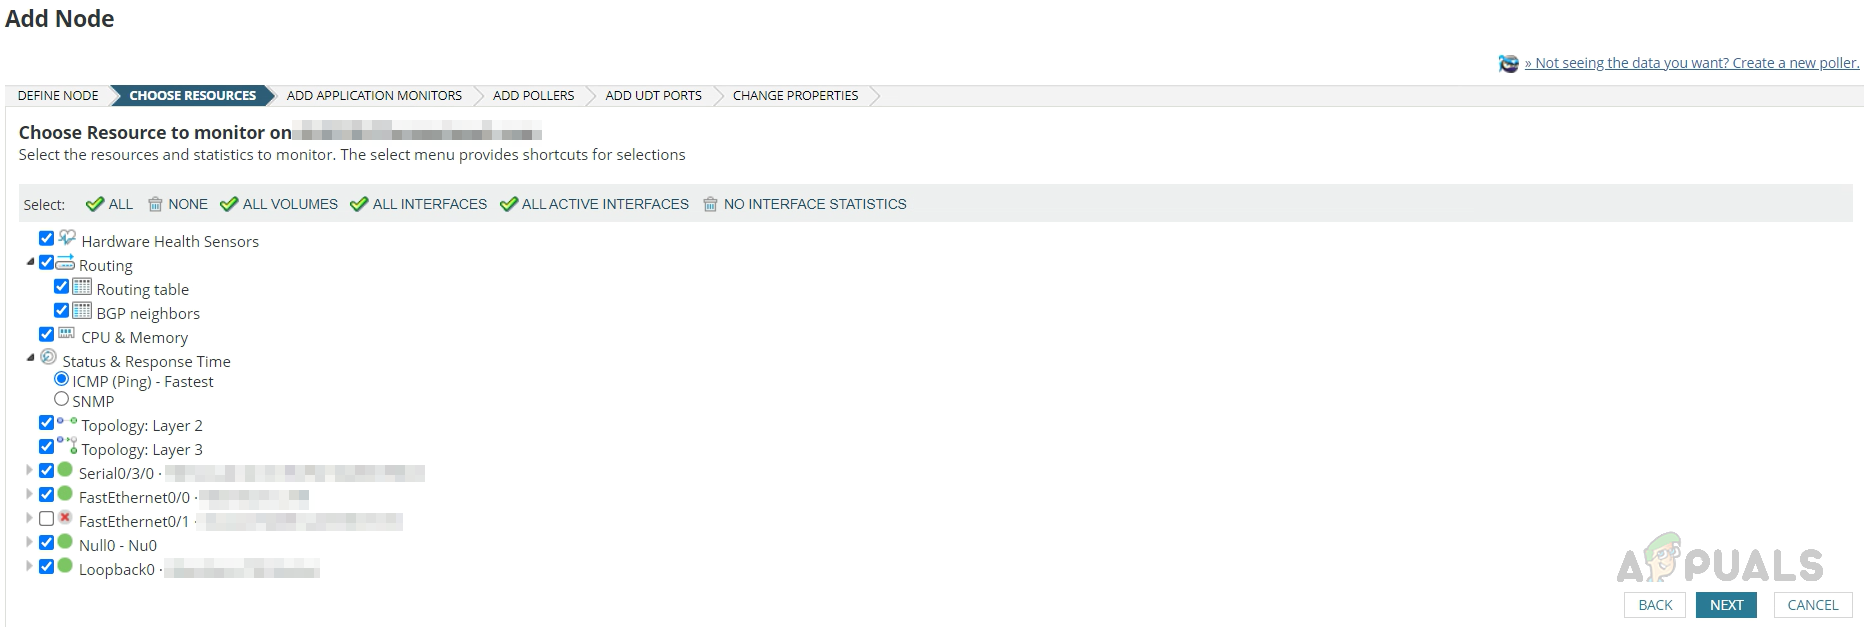
- On the resources page, select the necessary resources, including the interfaces you want to monitor, and then click Next.
- On the last page, review the details and click on Ok, Add Node.
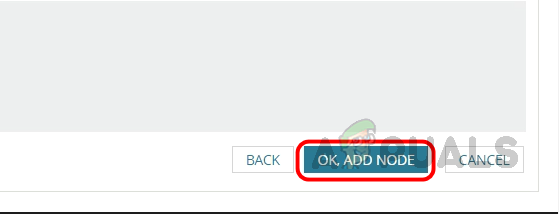
- Node and interfaces have been added to monitoring successfully.
Enabling NetFlow on the Interface
Once the interface has been added to monitoring, we can see the bandwidth utilization data, but NetFlow needs to be enabled on the respective interface to get complete flow details. Let’s proceed with the below steps to enable NetFlow on a test Cisco Router and configure Solarwinds NTA to capture the flow details sent by the interface.
Enable NetFlow only on the required interfaces to avoid any issues on the Network since enabling NetFlow on all interfaces will generate unwanted traffic, and it will store unwanted data outrun the storage of the Solarwinds database.
- Login into your router using Putty or your preferred terminal application.
- Go to global config mode and enter the below commands.
- Enter the command, Here, replace the IP Address with your Solarwinds NTA server IP and NTA uses the UDP port number 2055. This port needs to be allowed in your Firewall.
ip flow-export destination 10.0.0.2 2055
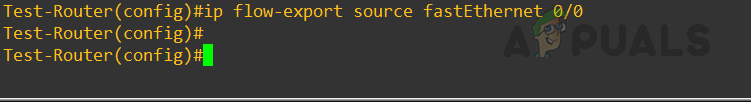
 Now mention the flow source using this command. Flow source is your interface from which you want to export the NetFlow data to Solarwinds NTA. Here my source interface is FastEthernet 0/0.
ip flow-export source FastEthernet 0/0
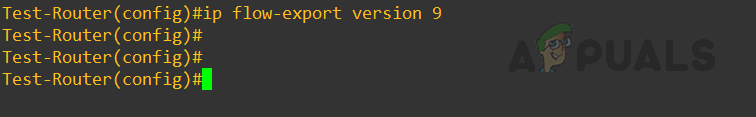
- Configure the flow-export version. If version 9 doesn’t work, user version 5.
ip flow-export version 9
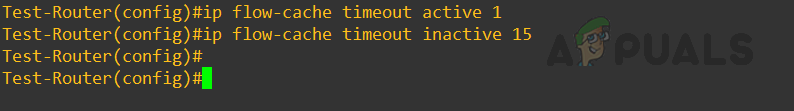
- Set flow-cache timeout active and inactive using the below command.
ip flow-cache timeout active 1
ip flow-cache timeout inactive 15
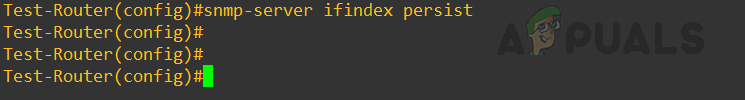
- Now enter the below command.
snmp-server ifindex persist
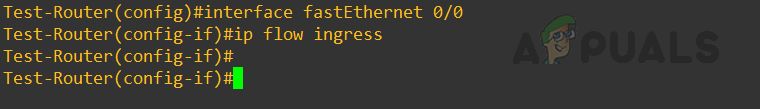
- Now go to the interface and enter the command below to enable NetFlow.
ip flow ingress
We are done and ready. Now we are ready to capture the flow details using Solarwinds NTA.
Adding Interface to Flow Sources
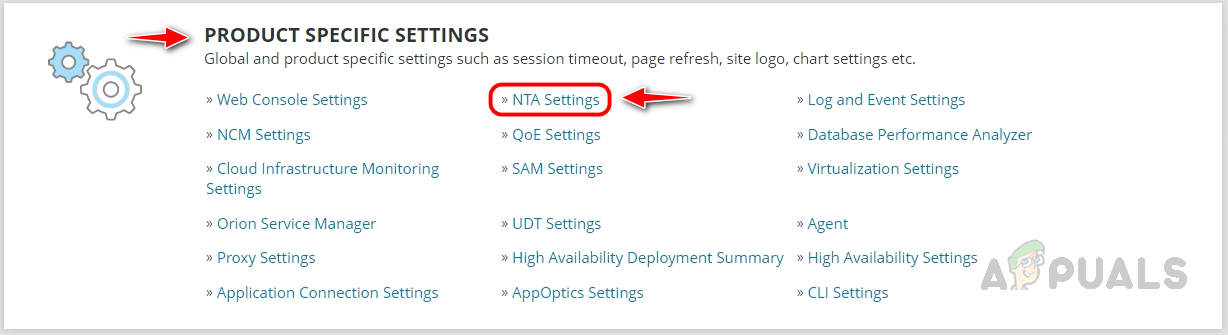
- Go to Settings and click on All Settings.
- Click on NTA Settings under Product Specific Settings.
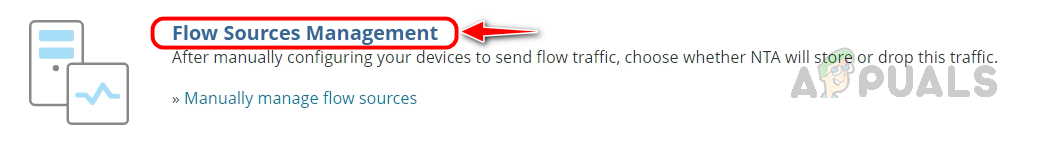
- In NTA settings, click on Flow Sources Management.
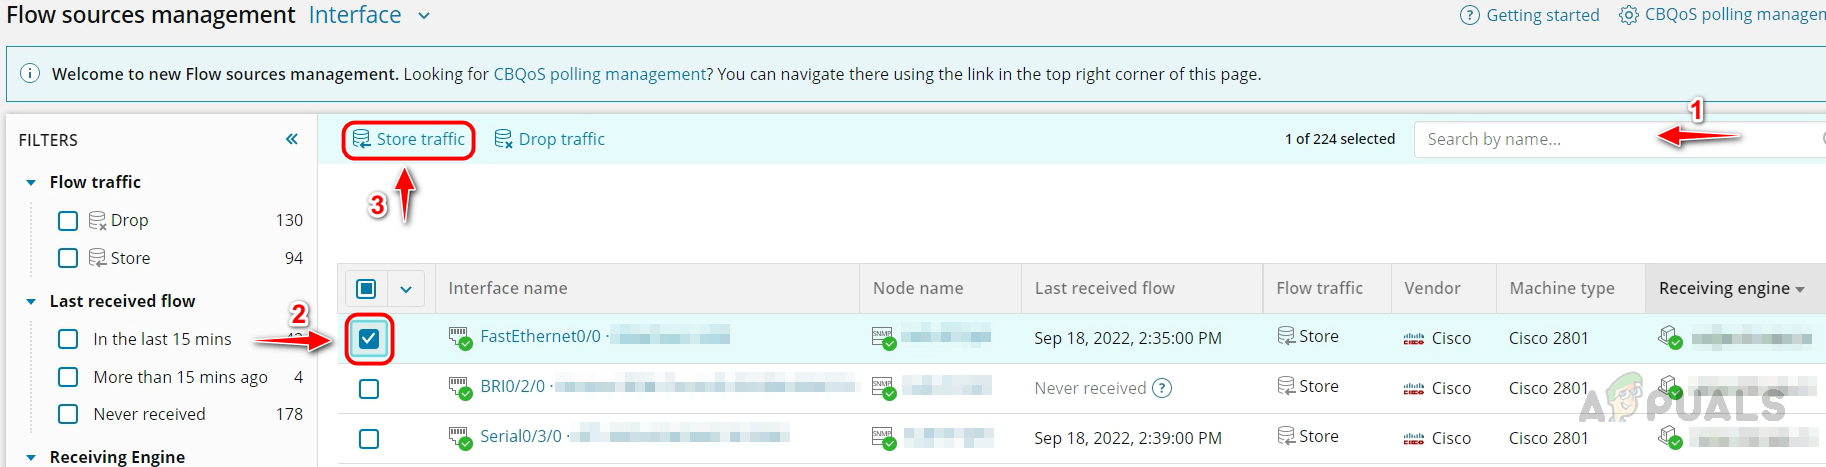
- Search for the node, select the interface that you want to store NetFlow data, and then click on Store Traffic. NTA will start store the NetFlow data sent by interface.
We have everything in place to monitor the interface’s bandwidth utilization and NetFlow data. Whenever we receive a high bandwidth utilization alert for this interface, we can identify the cause in Solarwinds NTA to fix this. Let’s see an example on how to check in Solarwinds NTA.
Identifying the Reason for High Bandwidth Utilization in NTA
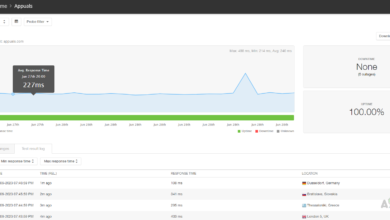
In this example, let’s assume we received a high bandwidth utilization alert for an MPLS interface from a router; let’s login into Solarwinds NTA.
- On the summary page, click on the expand button and the interface for the node we received alert.
Let’s assume we received an alert for the selected interface.

- On the next page, check the high bandwidth consumers under Top 5 Endpoints.
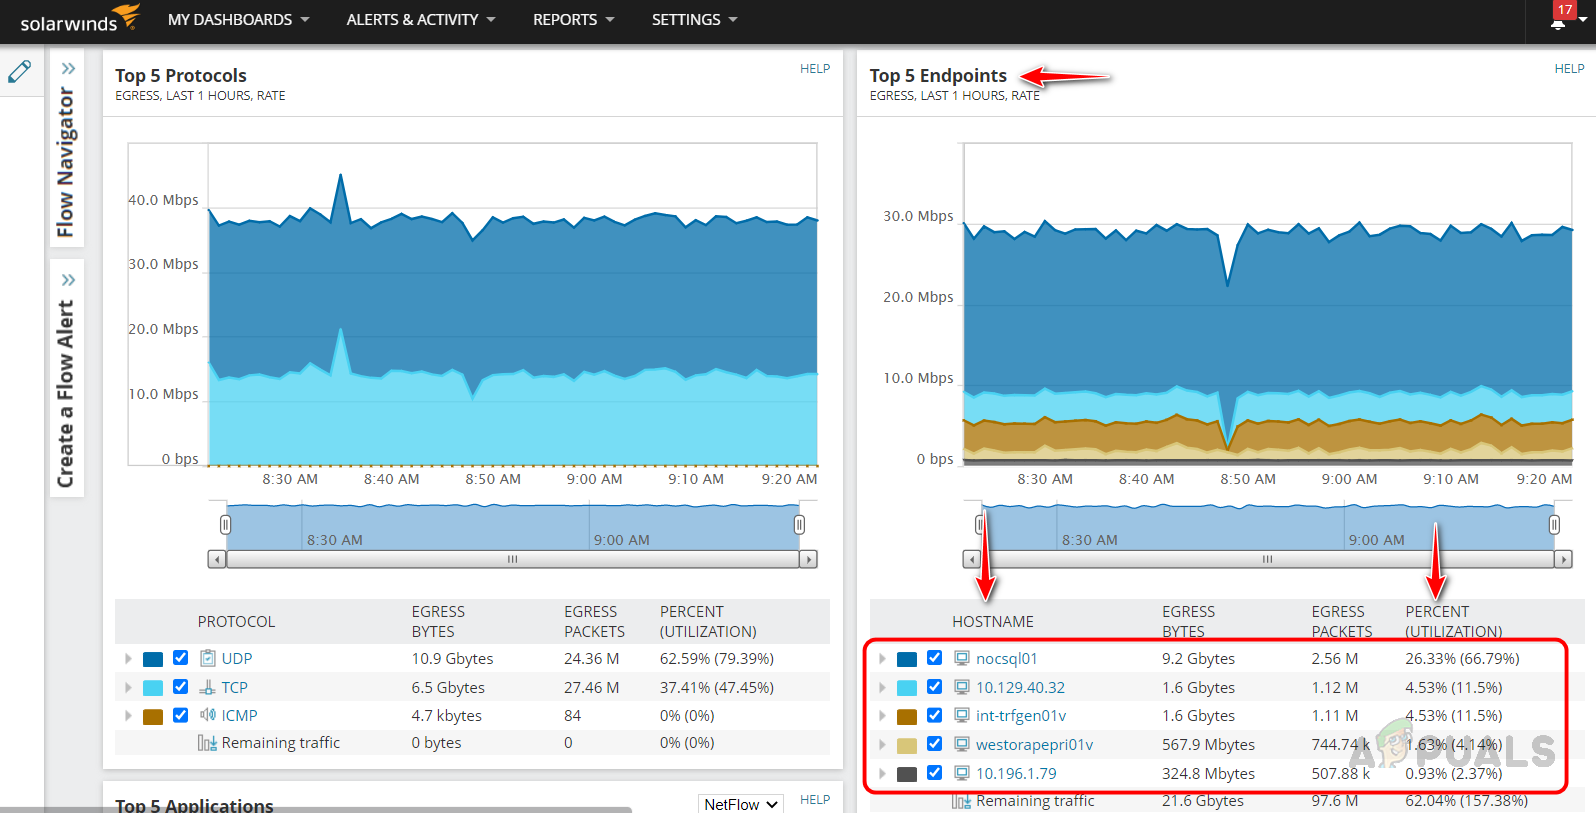
- Click on the node utilizing more bandwidth based on the utilization percent.
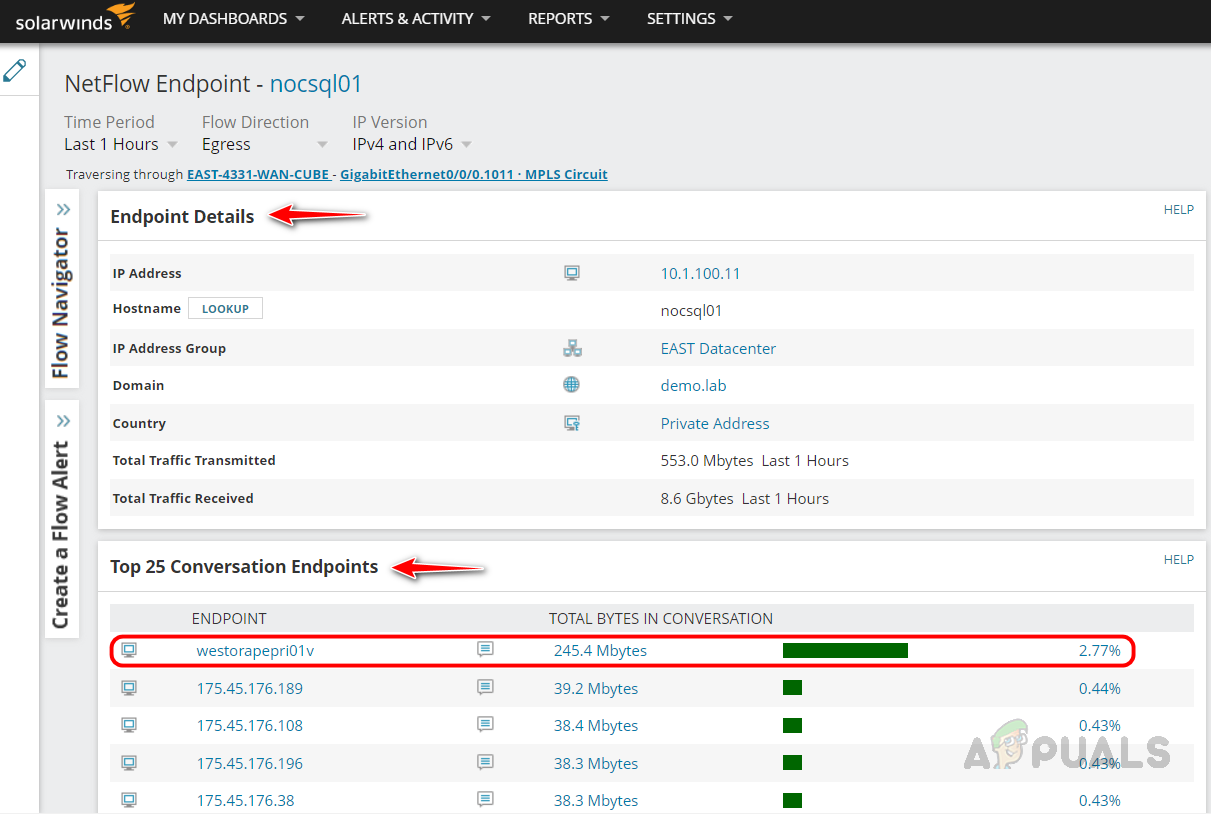
- In the Endpoint details widget, we can get the IP Address and other details of the device. In the Top 25 conversation, we identify what the other device is it’s communicating with, if the user is using an unwanted streaming application site, we can ask the user to terminate the session to restore the interface bandwidth.
- Apart from this, there is a widget called Top 10 Applications; there, we can see all the applications-related traffic; in the below example, you can see YouTube and Netflix. They are unwanted traffic on a production hour.
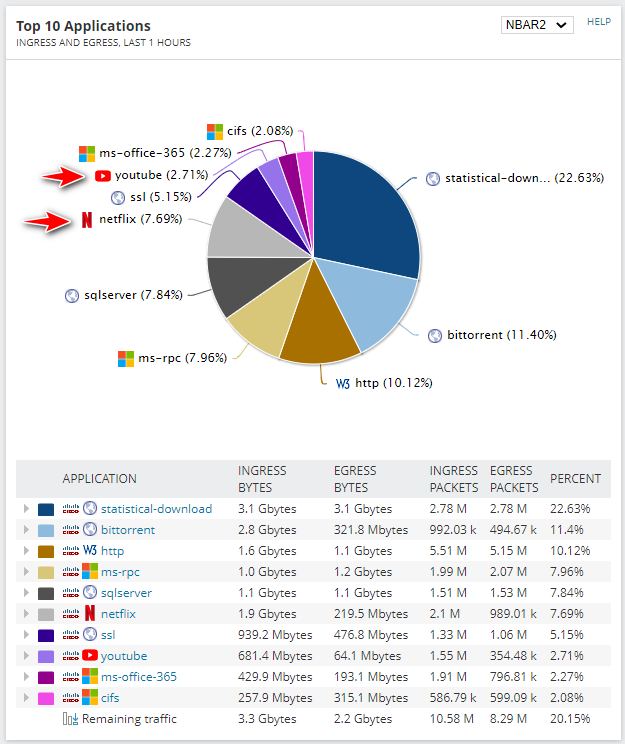
- If we click on any of the applications, it will take us to the summary there; we can drill down the user who is using those applications and ask them immediately terminate session to restore the bandwidth.
- Other widgets are available in Solarwinds NTA, like Top 5 Protocols, Top 5 Consuers, etc. We can refer to each and everything to find the cause of high bandwidth utilization.
This is how we can use Solarwinds NTA in our day-to-day activities to identify the cause of the issue and fix them immediately to avoid any major issues. Solarwinds NTA also provides powerful reports and alerts; we can also use them to avoid any issues proactively.