Monitor Bandwidth Utilisation with NetFlow Traffic Analyzer
Analyzing a network is something that cannot be taken lightly. Establishing a network is half the job done as there is a lot more to it than just setting up a network. Monitoring it and making sure it stays operational at times is the other half job that needs to be executed with utmost attention and responsibility. Neglecting this would result in often network outages or surges which is a big thing in this century. In this era, the dependency on computer networks has drastically increased and thus, the networks are larger than they ever were. One of the key things to monitor while monitoring your network infrastructure is to keep an eye out on the network traffic. The traffic that you are receiving on your network is of significant importance and thus, network admins need to look for the traffic that the network is receiving also known as Traffic Analysis. NetFlow or also known as Cisco NetFlow is a feature that was added to Cisco routers to keep track of the IP addresses that enter and exit an interface. Network traffic data is really important to network administrators as it provides better insights about the network with the help of which different security issues can be addressed.
For this purpose, automated tools (NetFlow Analyzers) have been introduced to help system administrators and get rid of the tiresome manual convention. Solarwinds NetFlow Traffic Analyzer (download here) is a tool that lets you do that with much more functionality. With Solarwinds NTA, you will be able to monitor the traffic data on your network, traffic flow, as well as monitor the bandwidth utilization on your network which is really important. Why you may ask? Most of the network performance issues that are triggered are caused by high network bandwidth utilization. Hence, the network often stops responding and ultimately leads to a crash or an outage. Therefore, in order to prevent this from happening, measures need to be taken for better management of the network which involves deploying an NTA tool in your network environment as it also works as a bandwidth monitoring tool. That is the reason why network bandwidth monitoring is important when it comes down to network devices.
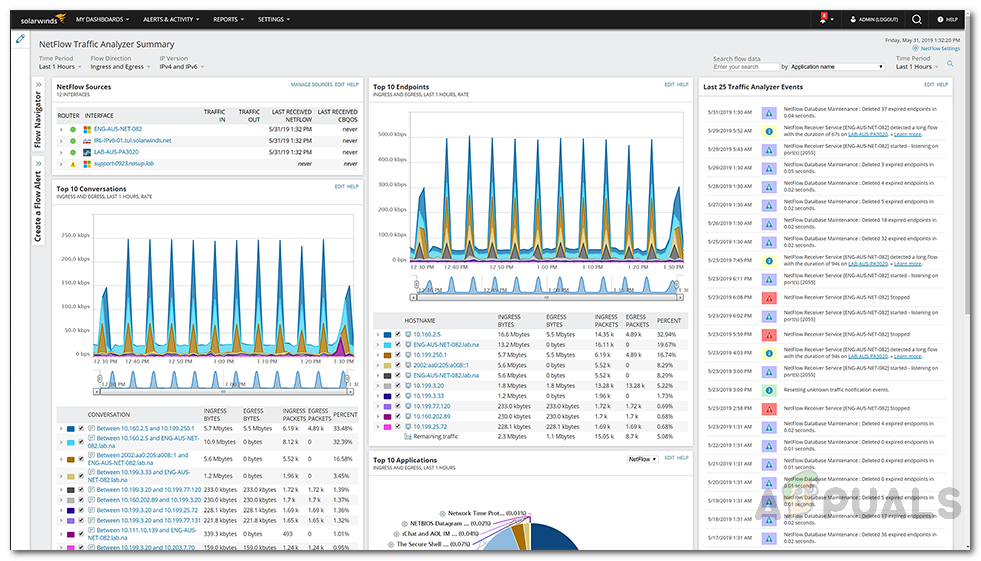
NetFlow Traffic Analyzer
There are tons of tools out there developed just for this very purpose, and if you do not know the right tool that will help you accomplish what you desire to achieve, you will not be progressing at all. Therefore, do not fret as we will be showing you a perfect tool for the job with a great company to back it up with. Solarwinds is a company that no system or network administrators require an introduction to. Their list of products is industry-favorite and every IT administrator has come across one of their tools during their career at least. NTA integrates with the Solarwinds Network Performance Monitor which, as a result, offers more in-depth and real-time insights than any other software as it keeps tabs on the real-time data of the traffic usage. NetFlow Traffic Analyzer analyzes your traffic pattern as well as keeps an eye on your application traffic.
To be able to use the tool and monitor your bandwidth usage, you will first have to deploy the tool in your network obviously. If you haven’t used the tool previously, you will have to install it and then integrate it with the Orion platform. They also offer a free trial if you wish to try out the tool first before paying for it. Do not worry, the procedure is explained in clear words in documentation offered by Solarwinds which can be found here. They also offer a free version of the tool with limited features via which you can analyze NetFlow on your network. Once you have installed the tool, you are ready to begin the guide.
Identifying Bandwidth Consumers
To be able to monitor network bandwidth utilization, you will first have to identify the consumers of your network bandwidth. This is important as it is useful in the identification of root cause of the issue. Solarwinds NTA out-of-the-box sends out alerts when the bandwidth utilization exceeds (also known as bandwidth hogs) a certain specified value that is defined by default. The default value is 75%. If you wish to change that, you can do so by going to Alerts and Activity > Alerts. After that, head to Manage Alerts and then group it by Trigger Actions Type from the drop-down menu and then select Email a Web Page from the list. From the default alerts, you can change the value.
You will be able to identify top talkers (high bandwidth consumers) on your network when a bandwidth utilization alert is triggered. Once an alert has been triggered, you will be notified via an automated email. Here’s how to identify the top talkers:
- To identify the top talkers, head to the account you provided while configuring an alert. This is where the alert notification email will be sent. Open up the email and click on the link associated with it. This will redirect you to the NetFlow Traffic Analyzer interface details and the interface that caused the alert.
- Look at the Top 5 Endpoints resource graph. This will show you which endpoint is using the majority of the bandwidth.
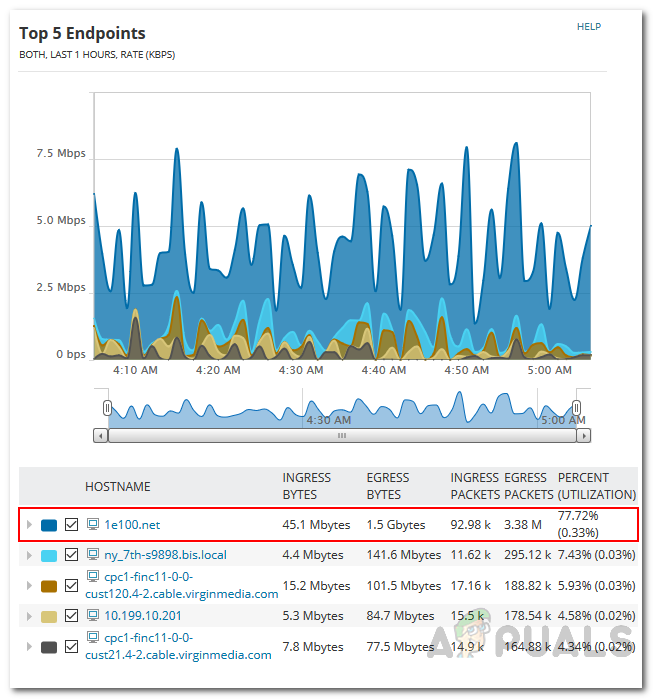
Top Five Endpoints - Under the graph, click on the endpoint which is using much bandwidth to view the details.
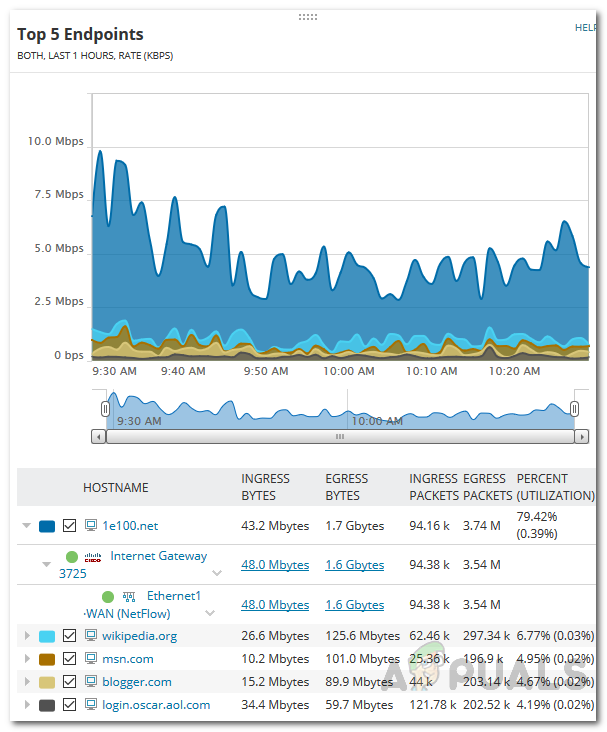
Endpoint Details - From the details, you will be able to identify the consumers that are consuming most of the bandwidth.
Monitoring Bandwidth Utilization
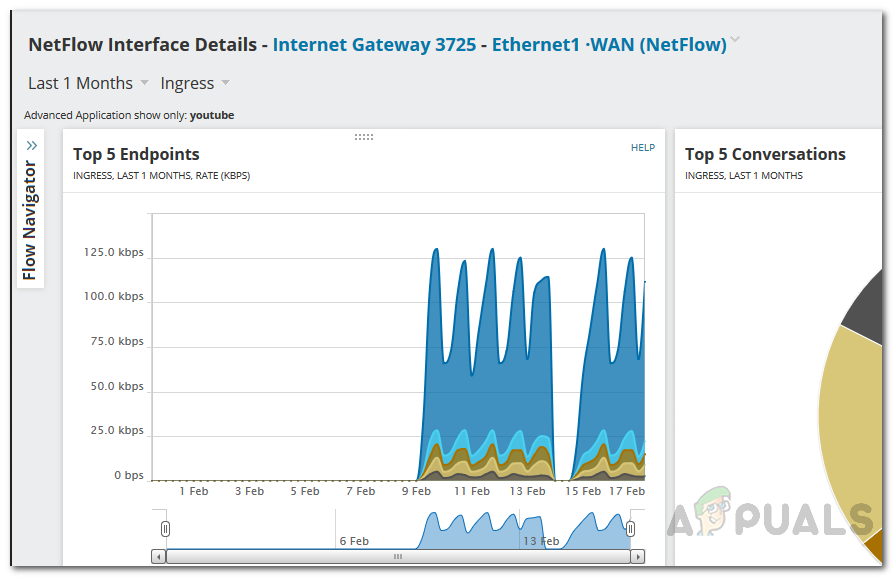
Now that you have identified the top talker, you can monitor the bandwidth utilization via flow navigator filters for that interface. In this scenario, we assume that you are aware of the interface that is causing high bandwidth utilization and you wish to keep an eye on it. To do this, perform the following steps:
- Head to NetFlow Interface Details of the interface you wish to apply filters on. The interfaces can be found in My Dashboards > NetFlow Traffic Analyzer.
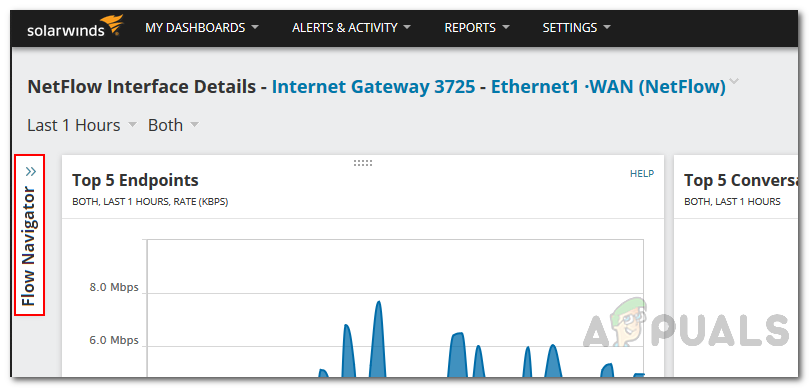
- Click on the Flow Navigator option on the left-hand side.
Interface Details - In the Time period option, select Relative Time Period > 1 month.
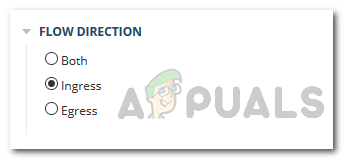
- Select Ingress in the Flow Direction option.
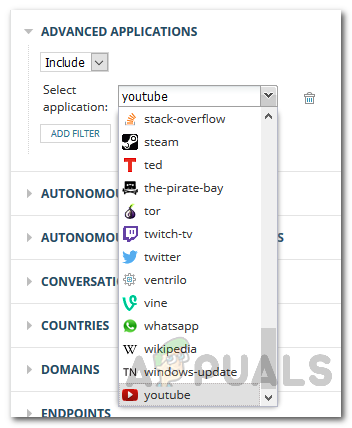
Flow Direction - After that, in the Advanced Applications, select an application that you wish to view directly in the NetFlow Traffic Analyzer Views toolbar.
Choosing Application - Finally, click the Submit button and you are done.
Interface Details