How to Monitor and Troubleshoot Active Directory Performance Issues?
Active Directory is a tool that makes the job of a system administrator really easy especially when it comes down to network management. The tool acts like a command center for the admin as he is able to manage the network, from the different devices in the network to the resources of the network. In this modern world, it has become a requirement to actively manage your network and all of its resources in order to ensure optimal performance of the network and to avoid any discrepancies. The performance of a network highly matters in this era as there are multiple competitors out there that could take the edge without you realizing.
In addition to that, network monitoring has become essential and for that purpose, you would require the proper tools so that your daily tasks become somewhat easier. When you have a proper tool in place that lets you monitor the performance of your network as well as troubleshoot any issues that may arise, you will have the ability to quickly resolve them before they are able to cause any damage at all. When it comes to tools for IT, SolarWinds is a company that requires no introduction due to their wide set of products that lets you monitor servers and applications from a single integrated interface so that you do not have to worry about anything. Using SAM, you will be able to troubleshoot any Active Directory issues as well as review the domain controller roles with so much more functionality. In this article, we will be showing you how to monitor and troubleshoot your Active Directory using the Server and Application Monitor by SolarWinds. Let us get started.
Downloading Server and Application Monitor
To get started, you would obviously need to download the tool first. Therefore, head to this link and download the Server and Application Monitor tool. SolarWinds provides a two week free trial period if you wish to evaluate the product, however, it is truly the best for the job. Once you have downloaded the installer, you will have the Orion Installer on your computer which is a platform which integrates all your SolarWinds IT products into one place so that you are able to access and manage everything from one single place. With that said, follow the instructions given down below to install the Server and Application monitor:
- First of all, go ahead and run the downloaded Orion installer.
- Once the Orion Installer is up, you will be asked about the type of installation.
- Here, you can go Lightweight Installation which is best for evaluation as it installs all the required components on your system including an SQL Server. However, if you wish to use your own SQL server, you can choose the Standard Installation option provided.
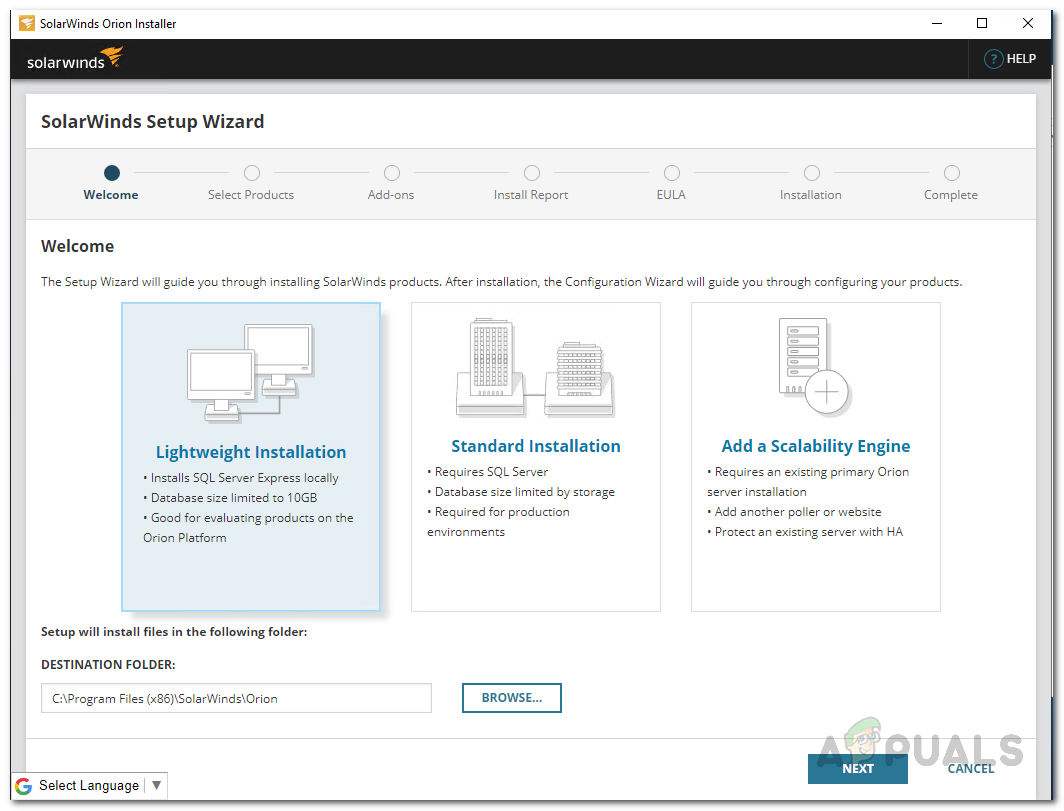
Choosing Installation Type - In addition to that, you can also change the destination folder of the Orion installer as per your requirement. Once done, click Next.
- On the Select Products page, make sure that Server and Application Monitor is selected and then click the Next button provided.

Select Products tab - After that, the Orion Installer will perform some tests on your system so wait for that to finish. Then, agree to the license agreement and click the Next button.
- The installer will start downloading the selected product and then install it on your system. Wait for it to finish the installation.
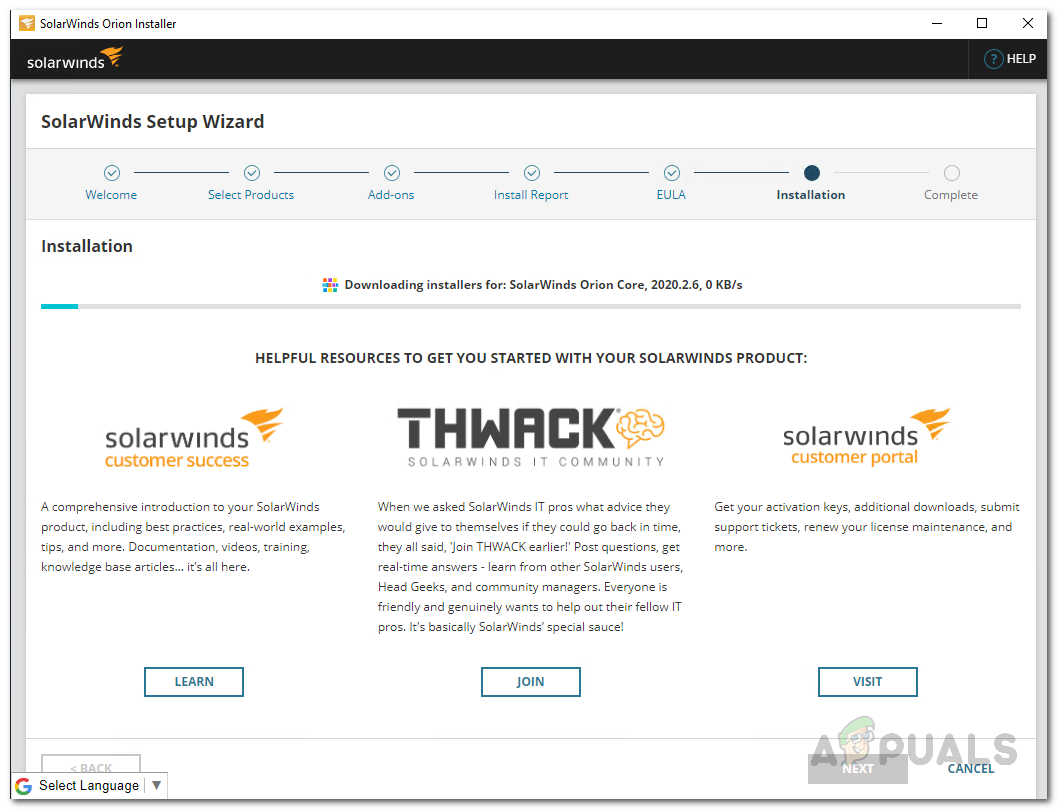
Installing Server and Application Monitor - Click the Finish button once the installation has completed.
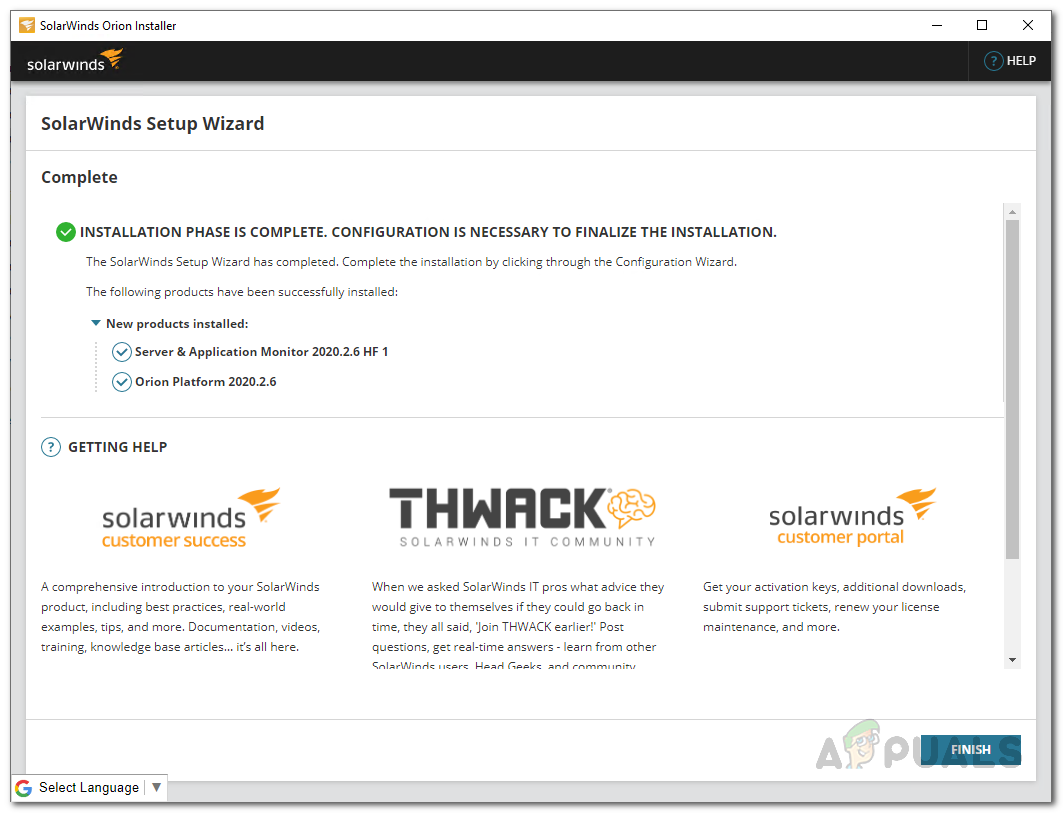
Server and Application Monitor Installation Complete - After the Orion Installer, a new window called the Configuration Wizard should come up. Here, you will be providing your database credentials if you went with Standard Installation. Follow through.
- On the Configuration Wizard, provide your database credentials when prompted and then click the Next button.
- Wait for the Configuration Wizard to finish configuring the Orion platform.
Discover your Environment
Before we get started with monitoring your Active Directory, you will have to first discover it and then add it to the Server and Application Monitor tool. Discovering your environment is really due to the Network Discovery wizard that can be found on the Orion web console. Once you close the configuration wizard, the web console should open up automatically in a browser. In case it hasn’t, you can access it by typing “hostnameORIPaddress:8787” in the address bar. Follow the instructions down below once you have accessed the web console:
- First of all, when you open up the web console for the first time, you will be asked to create a password for the admin account. Do so and then click the Save and Login button.
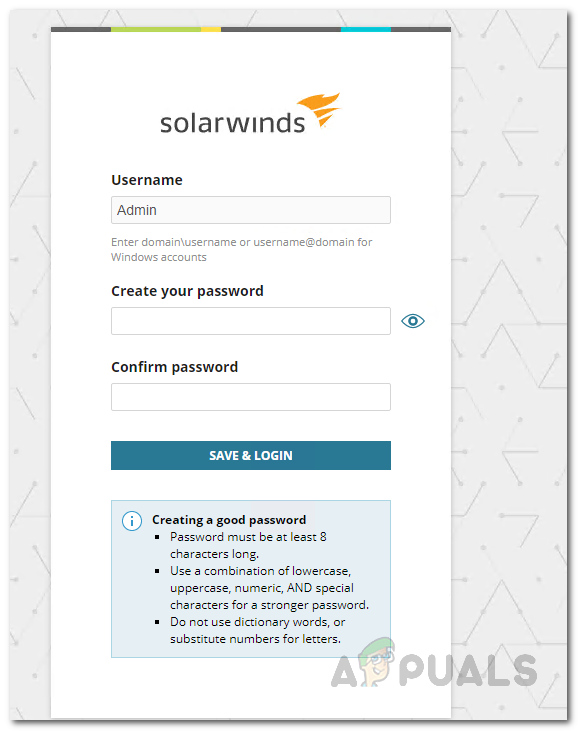
Creating Admin Password - After logging in, you will be shown the Network Sonar Discovery page automatically.
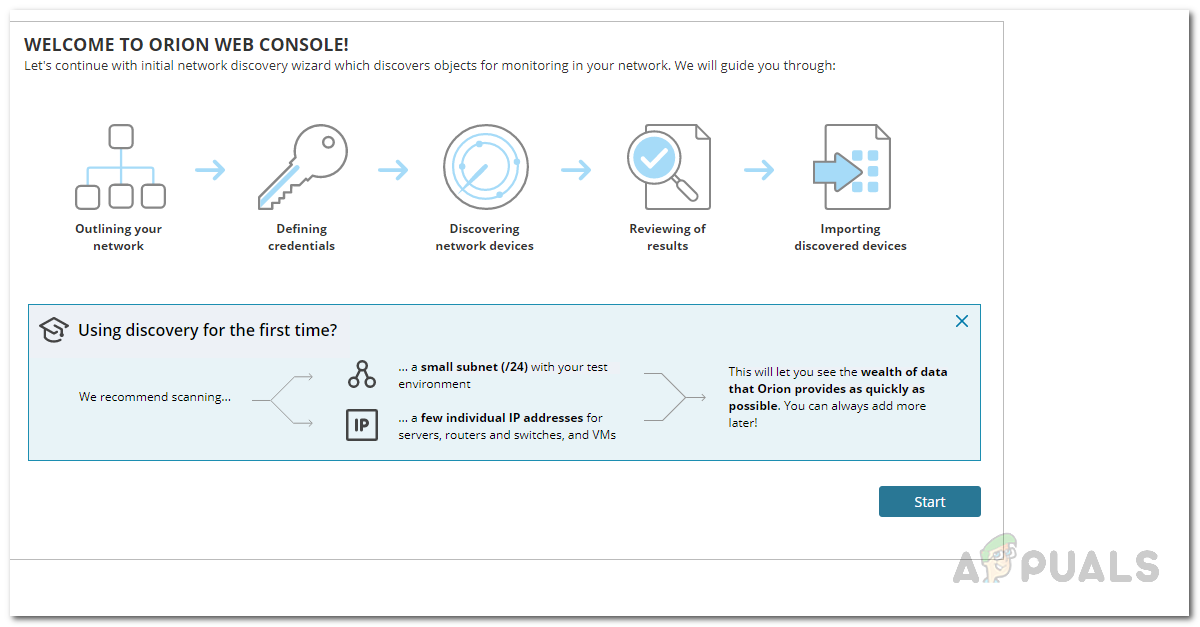
Network Discovery Page - In addition, you can also access it manually by clicking Settings > Network Discovery.
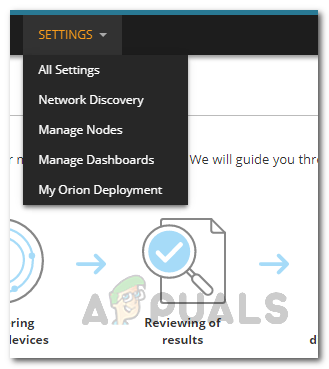
Settings Menu - On the Network Discovery page, click the Start button to start discovering your environment.
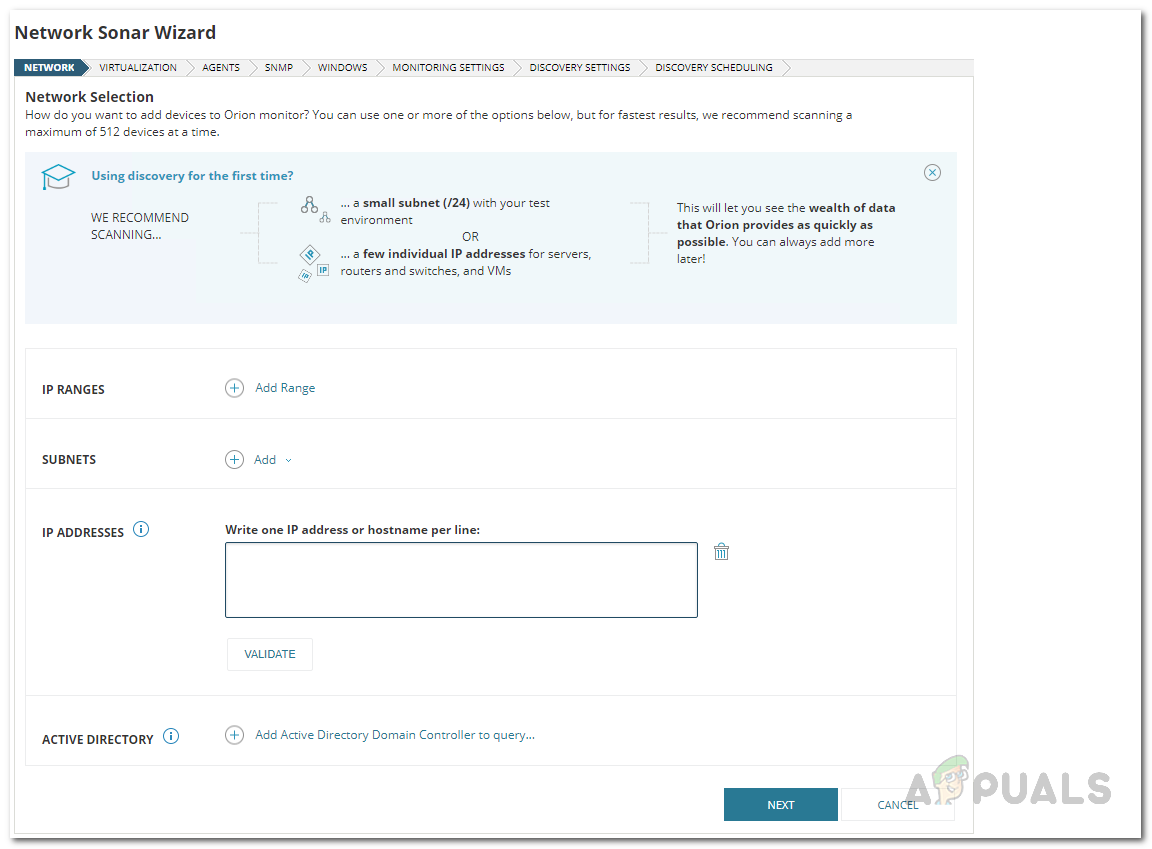
- The Network Sonar Wizard should start. On the Network page, click on the Add Active Directory Domain Controller to query.. option and then provide your details. Once you have done that, click the Next button.
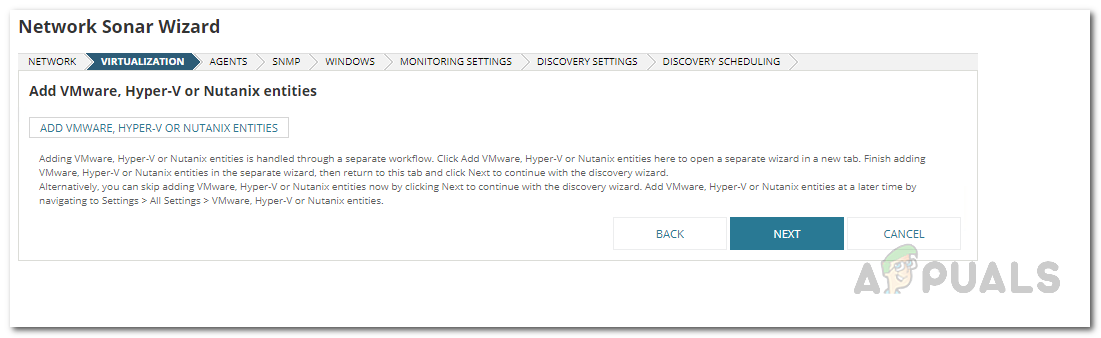
Providing Active Directory Details - On the Virtualization page, you will be asked to add any VMware, Hyper-V or Nutanix Entities. In case you wish to, click the Add VMware, Hyper-V or Nutanix Entities button provided. After that, click the Next button to proceed.
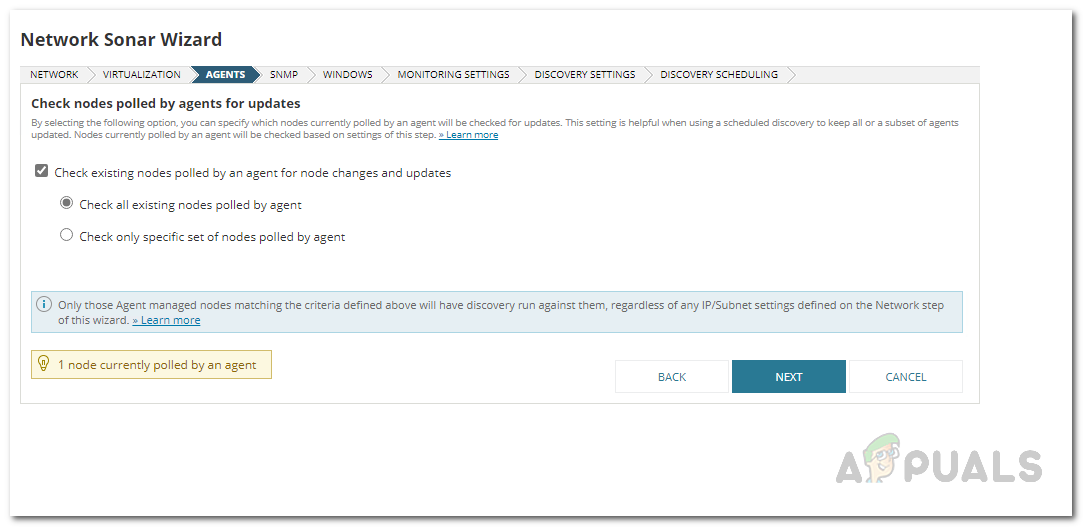
Virtualization Tab - Then, on the Agent page, go ahead and click the Check existing nodes polled by an agent for node changes and updates checkbox and follow it up by clicking Next.
Agents Tab - If you wish to provide any SNMP credentials, you can do so on the SNMP tab. Click the Next button to move on.
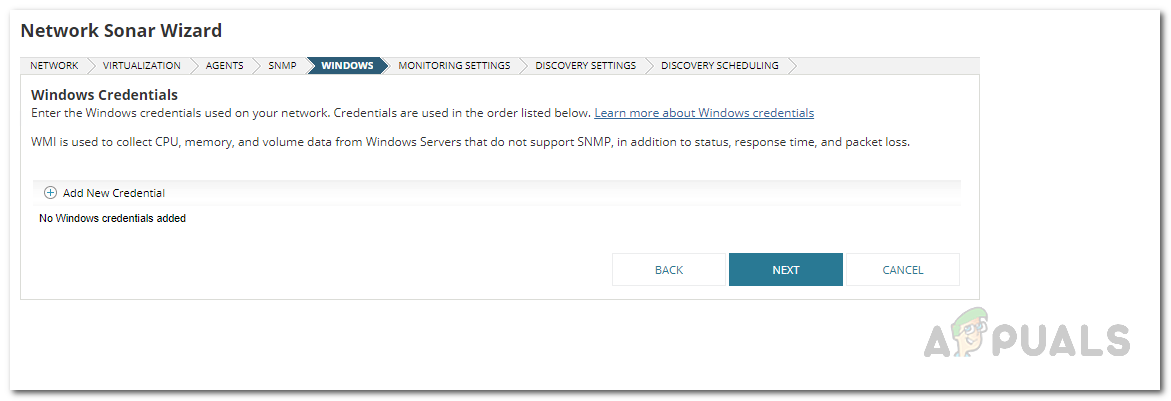
- On the Windows tab, you can provide any Windows credentials that are used on your network which will be used to collect CPU, memory and other data. Click Next.
Providing Windows Credentials - After that, on the Monitoring Settings page, since we are discovering Windows devices, go ahead and choose WMI as the Preferred Polling Method which is also recommended by SolarWinds. Leave the Manually set up monitoring after devices are discovered as it is and click the Next button.
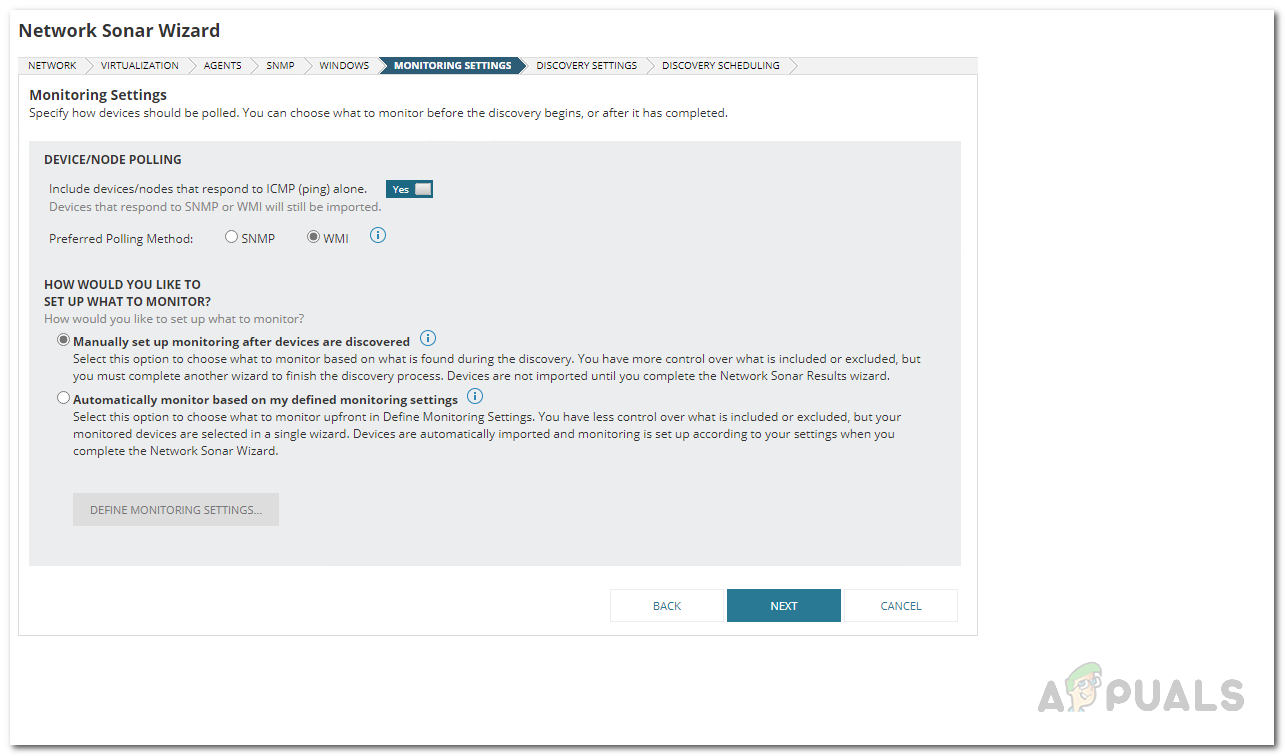
Choosing Monitoring Settings - Then, on the Discovery Settings page, simply click the Next button.
- Finally, on the Discovery Scheduling tab, you can choose to schedule the discovery at a later time as well if you wish to. After that, click the Discover button.
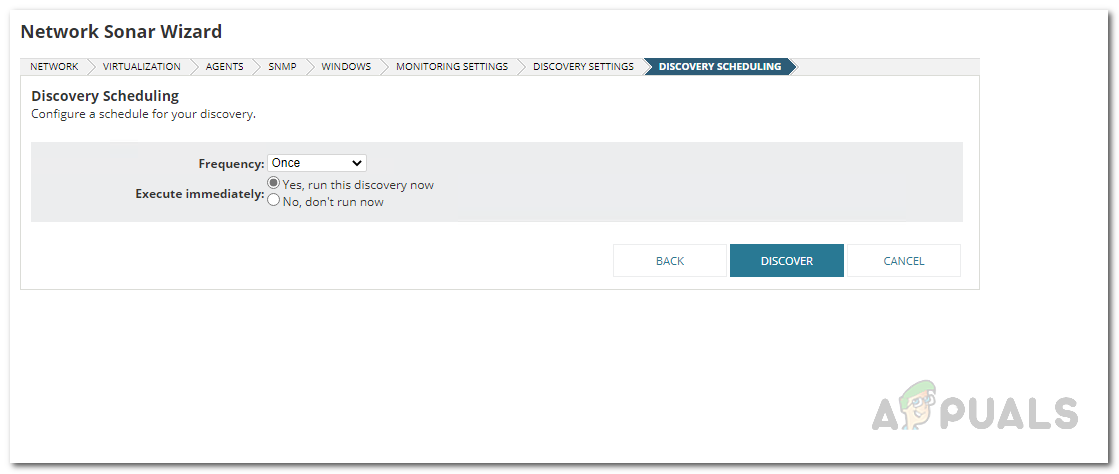
Scheduling the Discovery - Wait for the network discovery to complete as it might take a while.
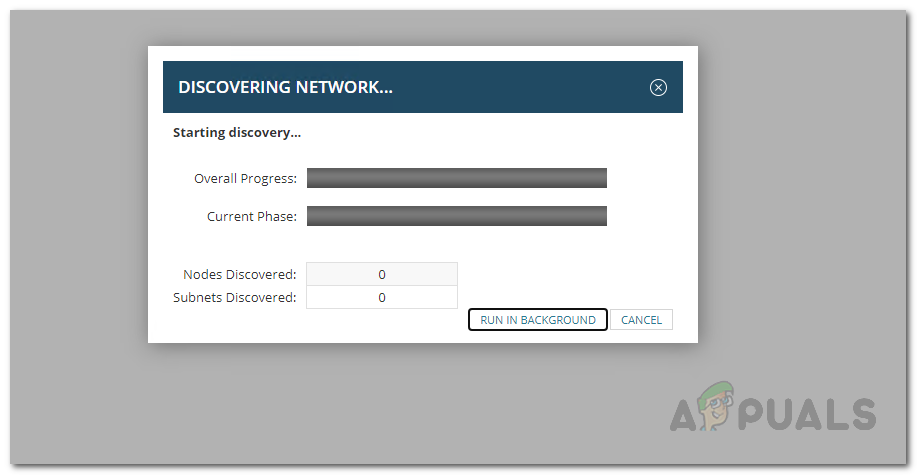
Waiting for Discovery to Finish
Adding Active Directory as a Node
Once the network discovery has been completed, you will be taken to the Network Sonar Results Wizard where you will be adding your Active Directory to Server and Application Monitor. The server is added to the Orion database as a node. Follow through:
- On the Devices tab, select the server you wish to import and click the Next button.
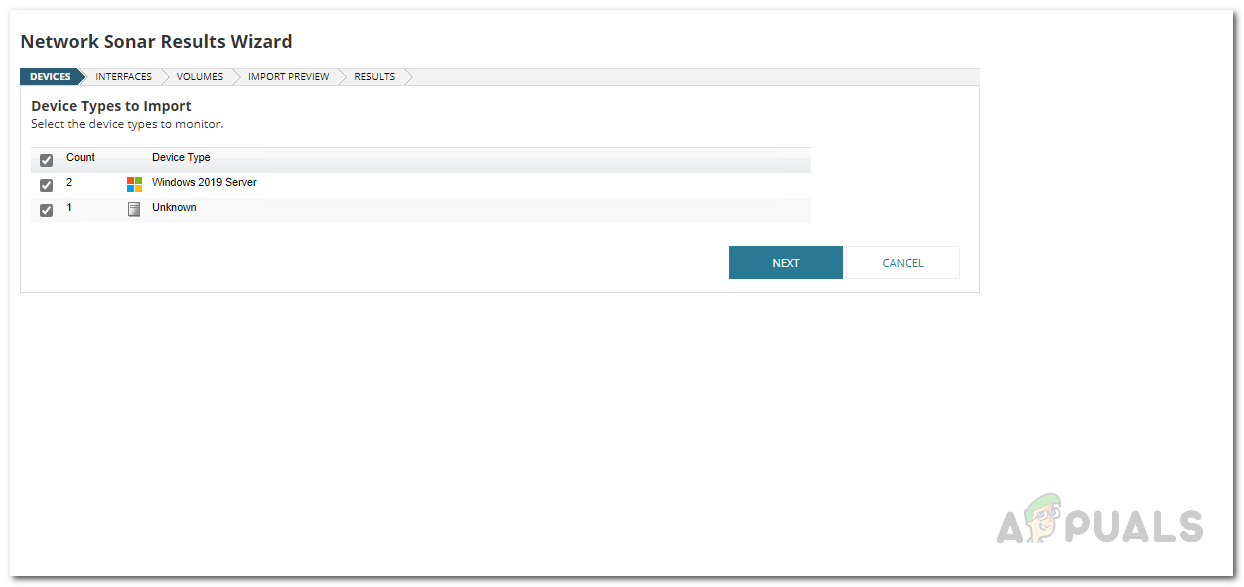
Netowrk Discovery Results - After that, you will be shown the interfaces that have been found during the network discovery on the Interfaces tab.
- On the Volumes button, you can choose what to monitor and then click the Next button.
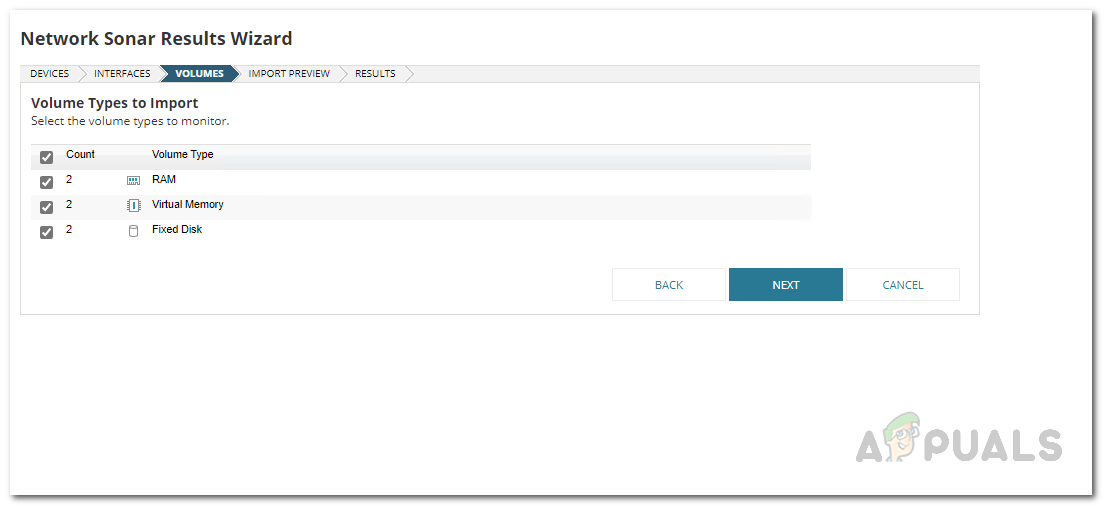
Choosing what Volumes to Monitor - Finally, on the Import Preview tab, you will be shown a summary of what the devices that you are importing to Server and Application monitor. Click the Import button.
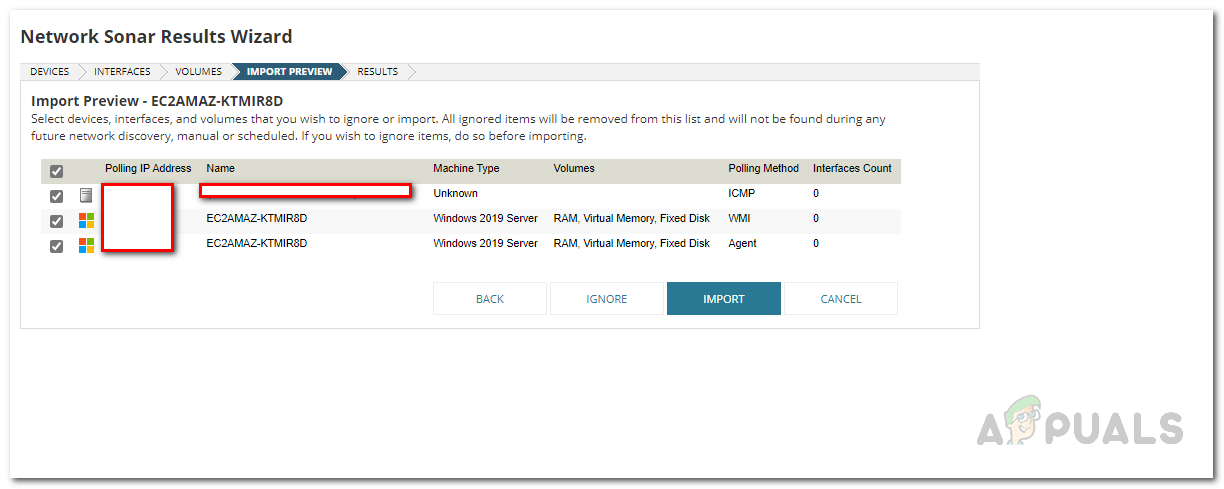
Previewing the Devices before Importing - Once it has finished importing the devices, click the Finish button.
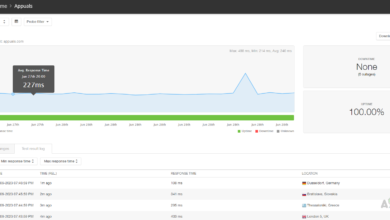
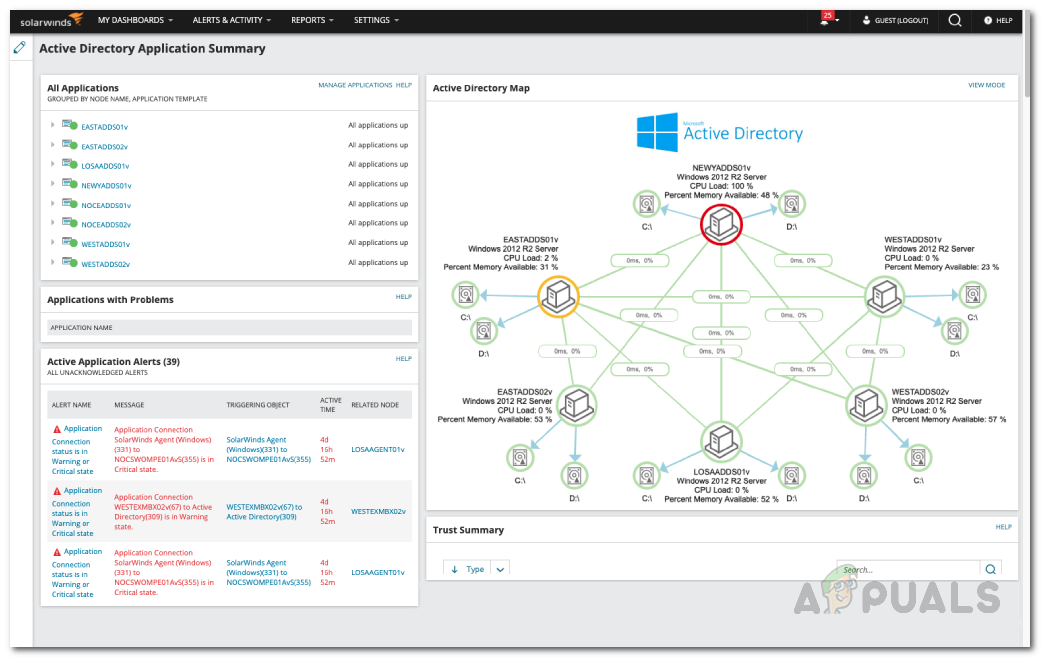
Monitor your Server
Once you have added your server to the tool, the agents will begin monitoring it and then display the data on the Orion web console. You can easily monitor the server that you have just added by going to the summary page of the product. To do that, click on My Dashboards > Server and Application > SAM Summary. It may not be available instantly as you have to allow it some time for polling. From the Active Directory Map, you will be able to see your network devices as well as monitor them for any performance issues.