How to Accelerate IT Infrastructure Issue Resolution using Hybrid Cloud Observability?
Every organization prefers to have a cloud-based solution for their IT infrastructure and there are quite good reasons for that. These days, clouds offer great features such as scalability that can allow any organization to scale their infrastructure without any worries as compared to having a physical setup. While this is all great, there are, as with everything, some drawbacks to using a cloud-based solution. This can include stuff like the visibility of your network and the increased time in issue resolution along with many more. These problems are not unknown and as such, SolarWinds came up with a tool that lets you take care of this quite easily.
It goes without saying that monitoring your network performance is of utmost importance at this point in time. SolarWinds Hybrid Cloud Observability allows you to counter the challenge of troubleshooting issues in a hybrid IT infrastructure along with the identification of the root cause of any issue. With the help of the Hybrid Cloud Observability tool, you are able to combine various tools in a single interface or solution that allows you to monitor and observe your cloud environments from AWS and Azure quite easily.
With that said, let us get started and show you how to implement the mentioned tool in any cloud environment so that you can track your issues more quickly and efficiently.
1. Installing Hybrid Cloud Observability
First things first, you will have to download and install the Hybrid Cloud Observability tool. This is fairly easy and you can opt for a trial period in case you wish to try out the product before purchasing it from SolarWinds. To download the tool, simply head to the link right here and fill out the form to download a 30-day, fully functional, free trial. Once the tool has been downloaded, follow the instructions down below to install it.
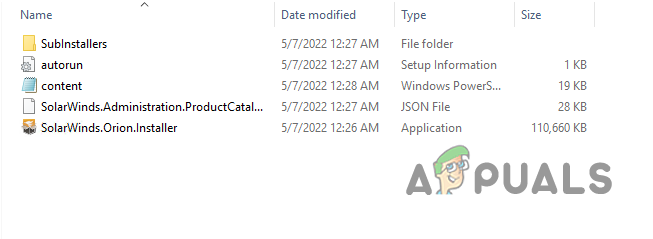
- Start off by mounting the downloaded ISO file. This can be done pretty easily by simply double-clicking the ISO file.
- After that, run the SolarWinds.Orion.Installer file.
Running Orion Installer - Once the installer window is open, click the Start button.
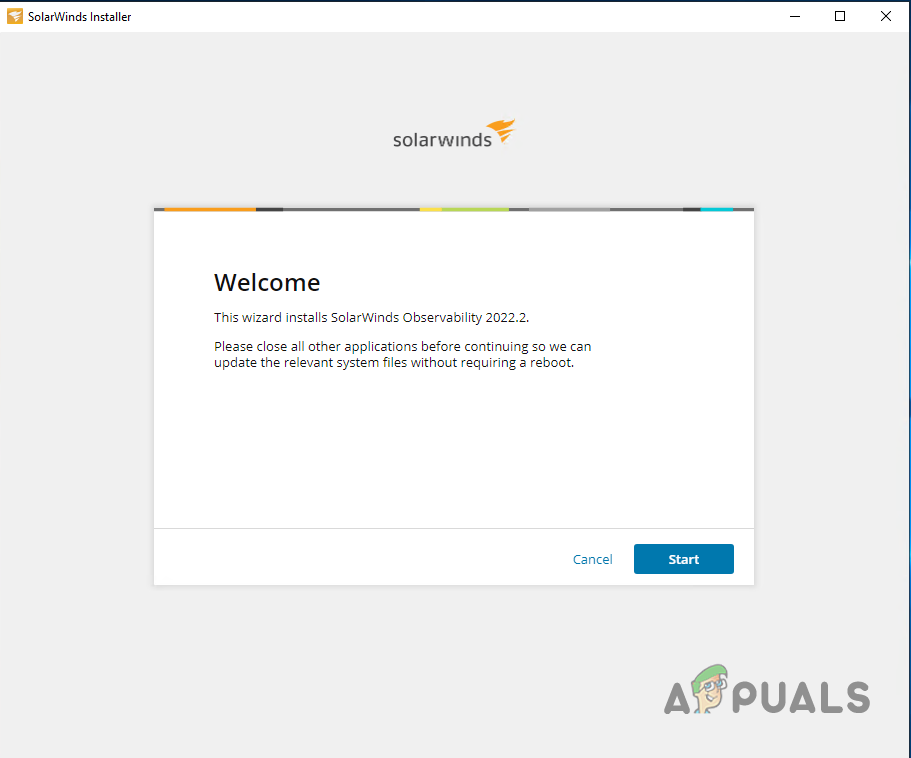
Hybrid Cloud Observability Installer - On the Installation Type tab, choose the type of installation you want.
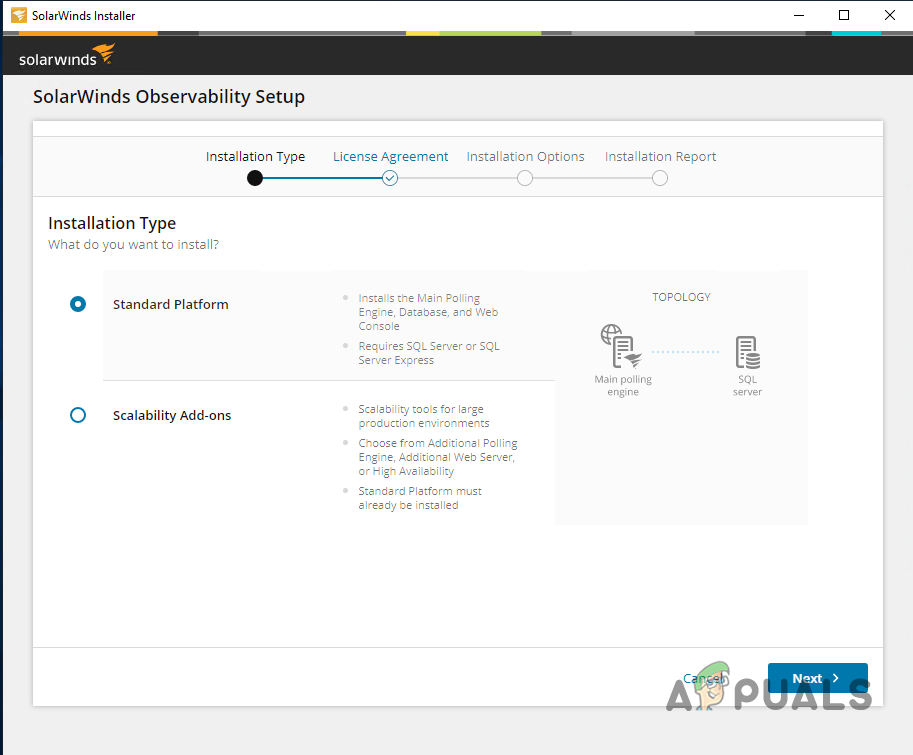
Choosing Installation Type - Follow it up by agreeing to the license agreement and then click Next.
- Then, on the Installation Options, if you wish to use an existing database, keep the Use SQL Server option. In case you wish to evaluate the product, you can opt for the Install SQL Server Express option. In addition to that, select the directory where you wish to install the tool by clicking the Browse button. Finally, click the Next button.
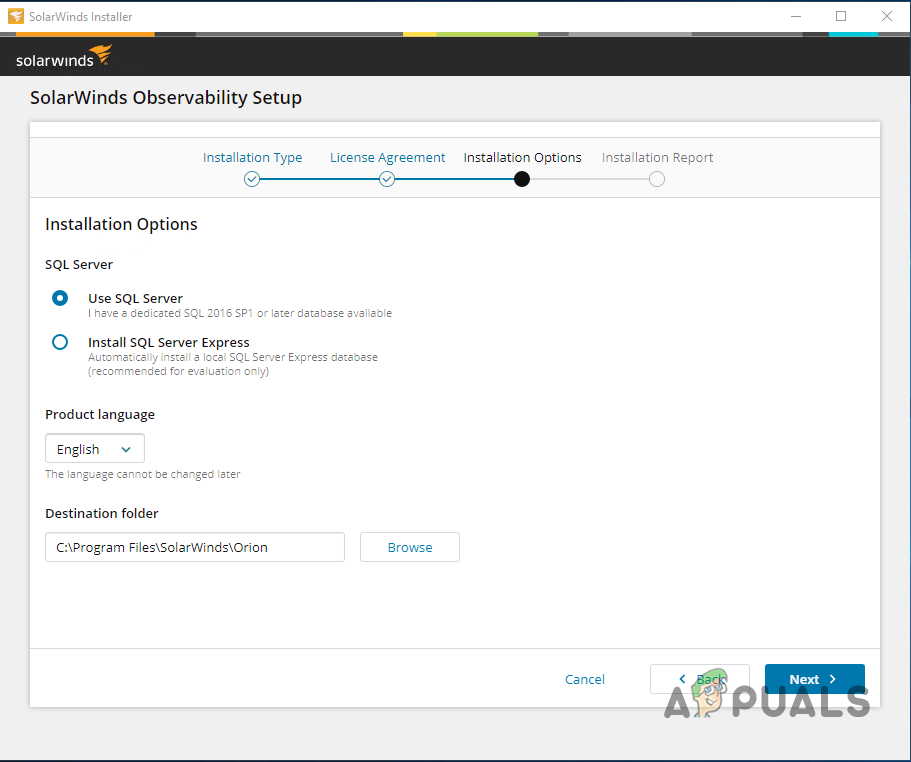
Installation Options - After the installation report has been completed, click the Install button to begin the installation process.
- Once the installation has been completed, the Configuration Wizard will open up automatically to configure the tool. Wait for it to complete.
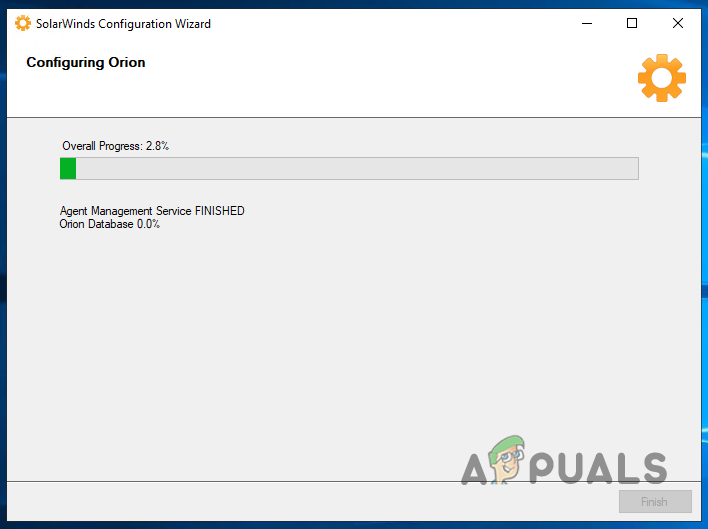
Configuration Wizard
2. Using the Orion Web Console
Now that you have installed the Hybrid Cloud Observability tool on your end, you can finally begin to use the various features of the tool to monitor your IT infrastructure, including Cloud accounts and more. As it turns out, the first step involves scanning your network using the Network Sonar Wizard tool. Using this, you can scan all of the nodes in your environment and then have the performance metrics on a dashboard for you.
In case of any issues or node failures, you will be notified instantly and you can also set up an alert system that notifies you via email if that’s what you prefer. With that said, let us get started with discovering your network.
3. Using Network Sonar Wizard
Using the Network Sonar Wizard tool is quite simple and it only requires a few simple steps. Let’s jump right into it.
- To start off, if this is the first time you are using the Orion Web Console, you will be asked to set up a password for the Admin account. Go ahead and do that and then click the Save and Login button.
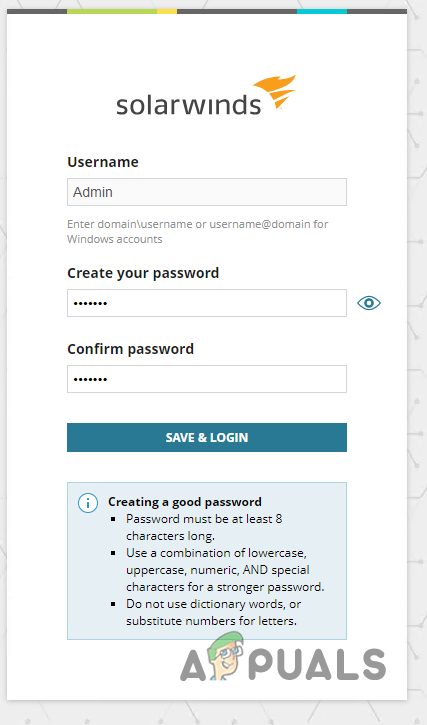
Setting up Admin Password - If the Orion web console does not open up automatically, you can access it by going to “HostnameOrIPAddress:Port”. The default port used by the Orion Platform is 8787.
- Once you have logged in, make your way to the Settings > Network Discovery option in the toolbar.
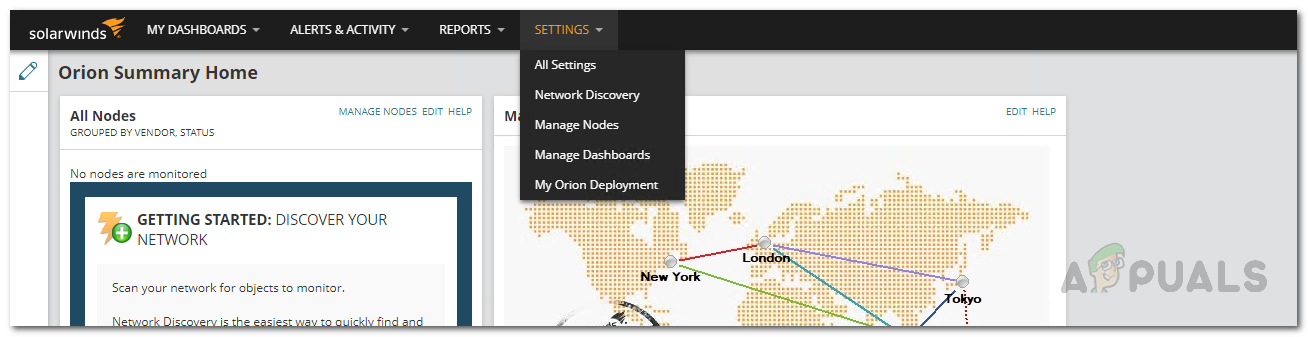
Orion Settings Menu - After that, click on the Add New Discovery option provided to initiate the Network Sonar Wizard.
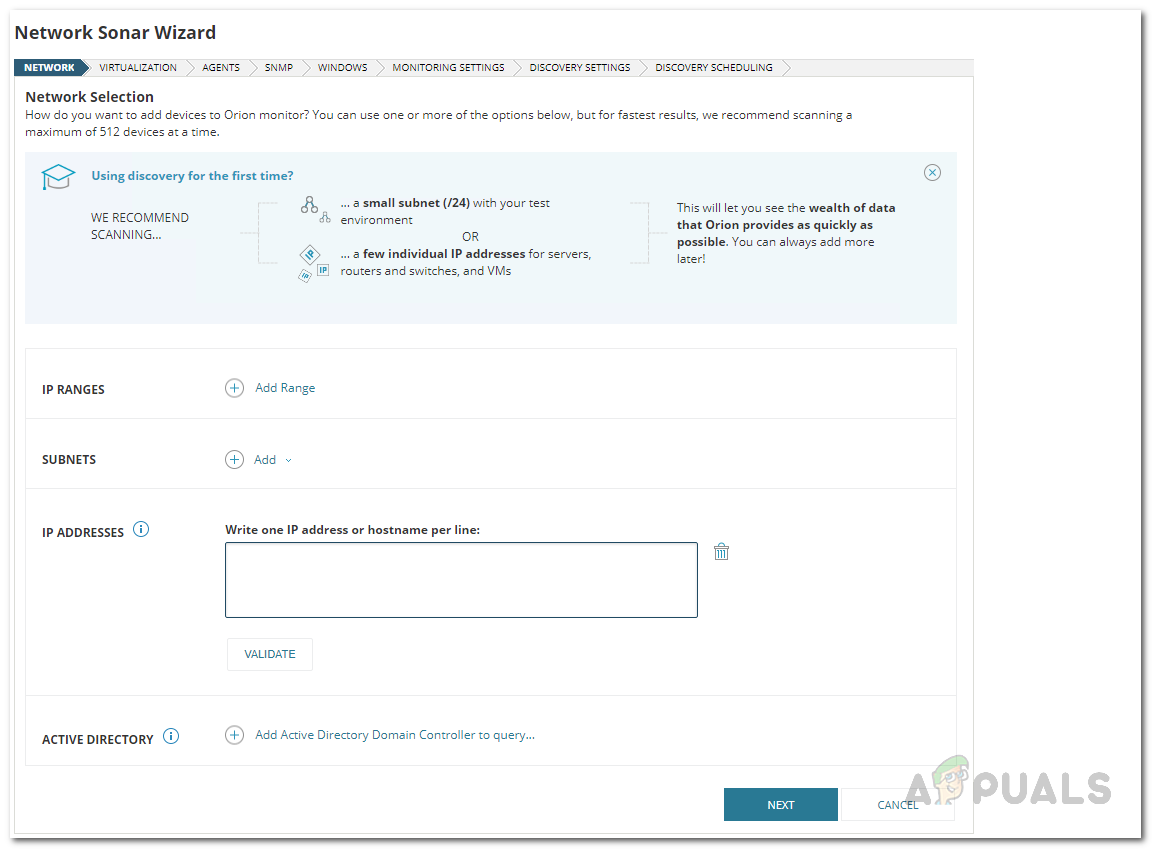
- Here, first of all, you will be presented with four different ways using which you can monitor your network or infrastructure. Once you have provided any one of the provided options, click the Next button.
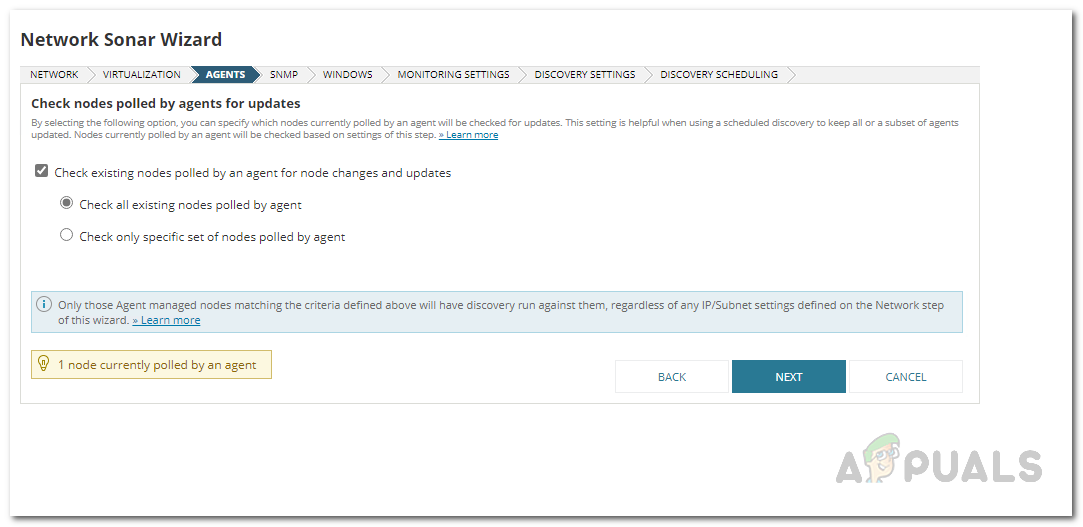
Discovering New Network - With that then, you will be taken to the Agents page. Select any of the provided options which are pretty self-explanatory and then click Next.
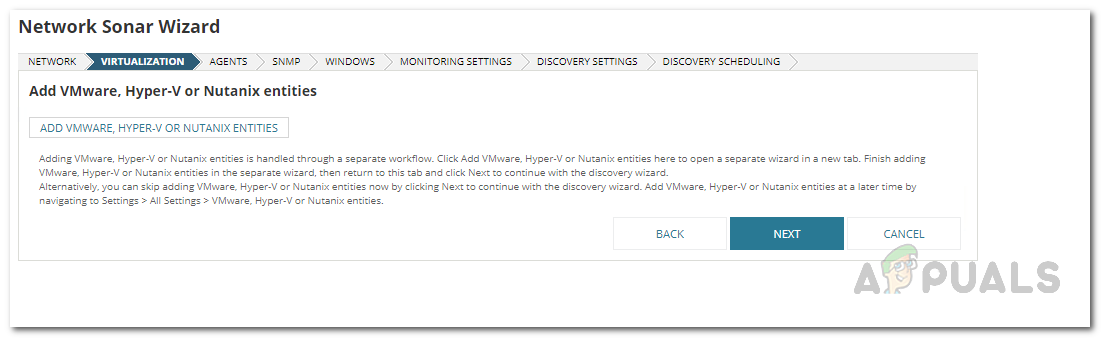
Agents Settings - Any virtual servers or hosts can be discovered on the Virtualization tab. Provide the required credentials to do so. Then, click Next.
Virtualization Settings - With that done, on the SNMP tab, you can provide any SNMPv3 strings that you might be using via the Add New Credential option. You can do the same for SNMPv1 and SNMPv2 as well. Once done, click Next.
- After that, if you wish to discover Windows machines in the network, you can provide the required credentials on the Windows tab.
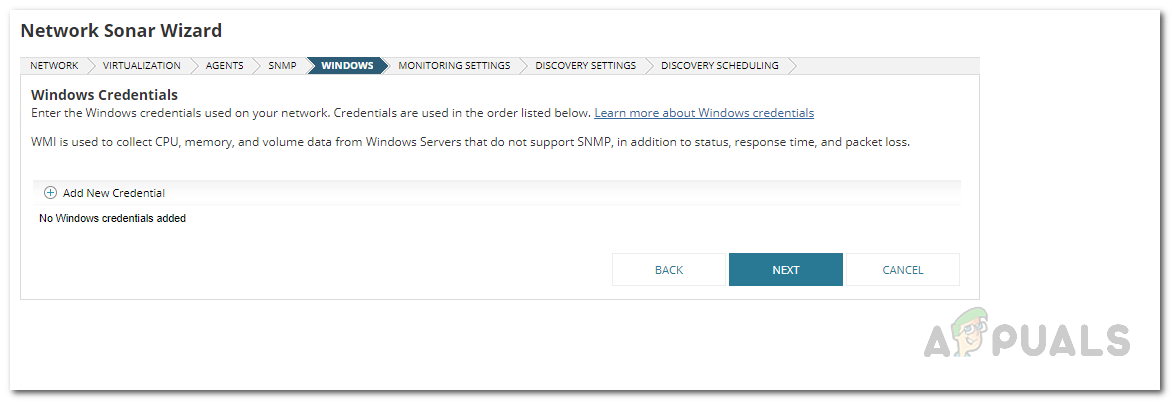
Windows Settings - On the Monitoring Settings tab, you can choose your preferred polling method. Solarwinds recommends using WMI if you wish to discover any Windows devices. Leave the other option as it is and click Next.
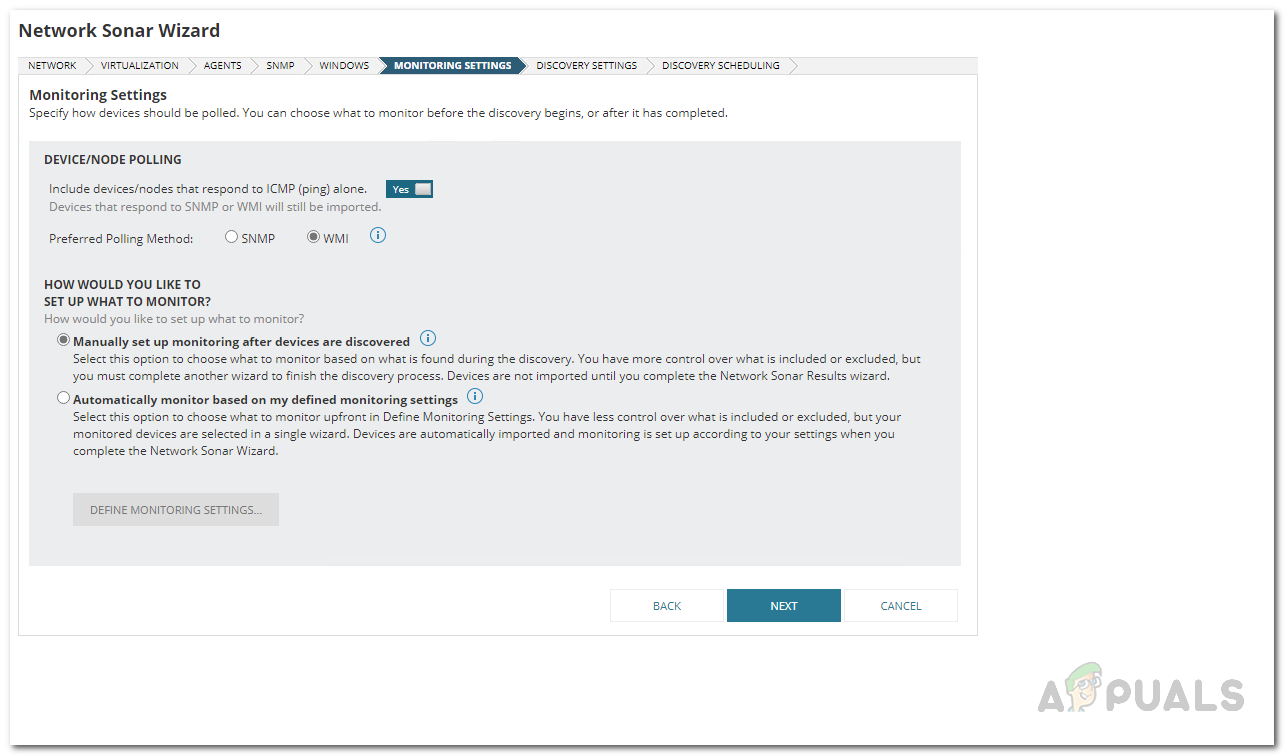
Monitoring Settings - Then, on the Discovery Settings tab, you can give the discovery a name. Click Next.
- Finally, on the Discovery Scheduling tab, click the Discover button to begin the discovery.
At this point, wait for the discovery to finish.
4. Adding Discovered Devices
Once the discovery process has been completed, you can add your discovered network so that it will be monitored and you can get timely updates. To do this, follow the instructions given down below:
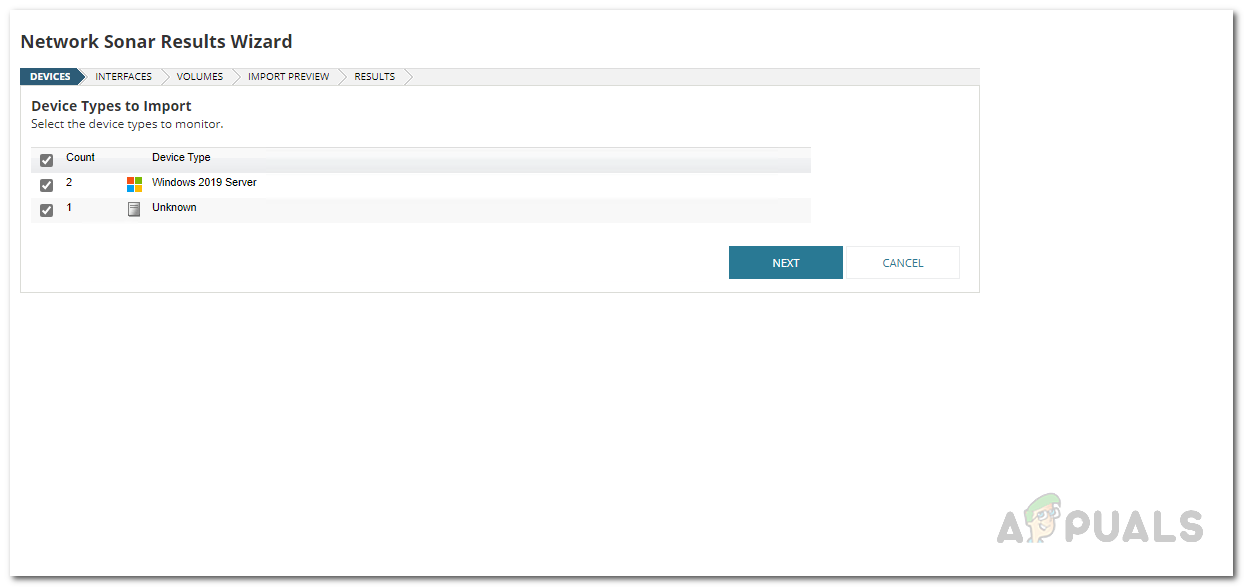
- Upon the completion of the discovery, the Network Sonar Results Wizard is brought up automatically.
- There, choose the devices that you wish to monitor on the Devices page. Click Next.
Discovered Devices - On the Interfaces tab, select the type of interfaces you wish to monitor and click Next.
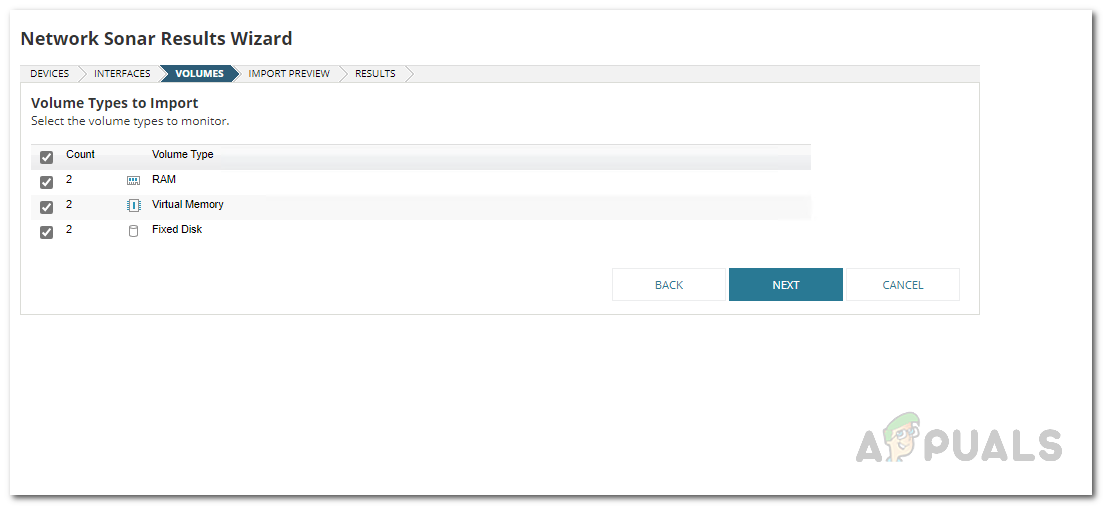
- Finally, follow this up by choosing the volume types that interest you and click Next again.
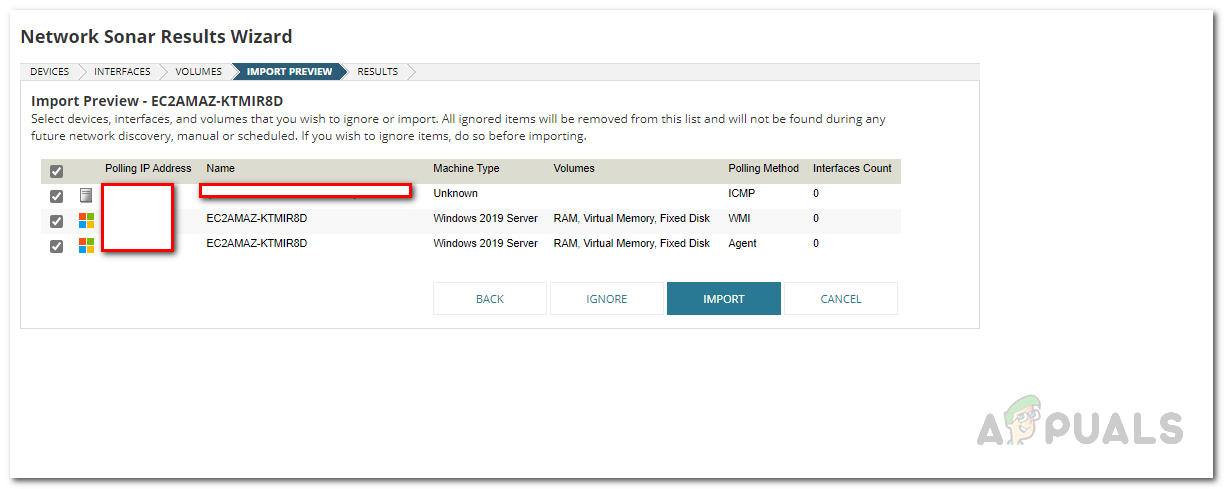
Choosing Volumes - At this point, you will be shown a summary of your import. Preview it and then click the Import button.
Previewing Import - Wait for the devices to be imported and then finally click the Finish button.
With that done, you have successfully added your discovered devices.
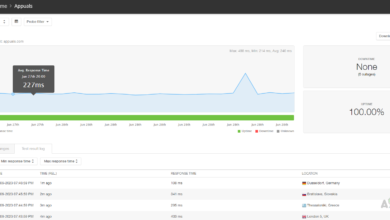
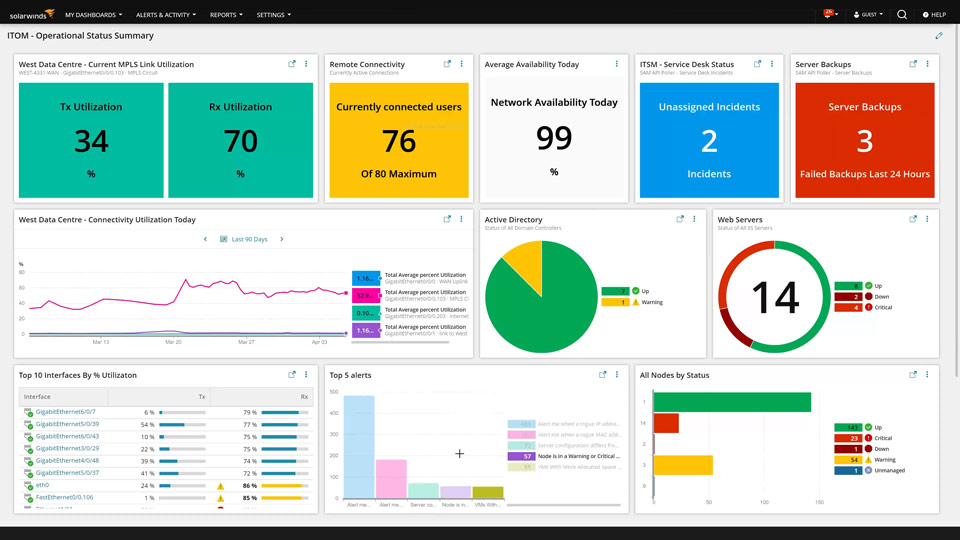
5. View your Infrastructure
At this point, you have completed all the necessary steps in order to add your network to the tool so that it can be monitored. You will be shown the performance metrics along with a lot more information momentarily on the Hybrid Cloud Observability page of the dashboard.