How to Analyze and Monitor CPU Load in Realtime on Cisco Routers?
In this evolving world, a network exists everywhere. Everything that we try to access over the internet exists over a network where multiple devices are communicating with each other continuously; sending and receiving data. All of these networks are set up and monitored by network admins but you already know that. You also know that there are multiple devices in a network which includes routers, switches and much more equipment. IT admins have to monitor their network to have a better understanding of what’s going on in their network and keep a track on all the devices.
What do they worry about the most? The obvious answer would be the performance of the network. If there are any network outages or downtimes, it is basically a nightmare for network administrators.
One of the important things that needs to be monitored in order to keep the performance of the network optimum. Networks are bound to have problems and issues. Some of these issues are related or caused by CPU utilization. The CPU utilization of the routers in the network. This includes the routers and many other network devices.
Therefore, monitoring the CPU load of the Cisco routers in the network is really important. This is because if the devices are utilizing more CPU bandwidth than it should be or if a device is not being able to utilize sufficient memory, the network will show weird behavior which includes slow response times. Having slow response times or high latency is basically unacceptable in this competitive world as it definitely gives your competitors an edge especially if you are an online business.
To avoid such issues, the utilization of the cores of the CPU in the network has to be monitored. How? We will guide you through.
How to Monitor CPU Load on Cisco Routers?
Obviously, you cannot monitor the number of processes that are being executed by the CPU in the network manually. Thus, you will have to use tools that have been developed for the said purpose by companies. Solarwinds is a big name in the network and system management field because of the quality of the products they develop. Solarwinds Engineers Toolset (download here) is no exception here.
Engineers Toolset, as obvious from the name, is a product developed by Solarwinds that includes over 60 tools that prove very useful and helpful to network admins. With the help of these tools, you will be able to monitor availability and latency of network devices (link the article here), troubleshoot network issues via the diagnostics tools packed in the toolset as well as manage network logs and much more. Without a doubt, it packs the best tools and utilities for network administrators.
That is why, we will be using ETS (Engineers Toolset) in this guide to show you how to monitor CPU utilization. Therefore, download the tool from the link provided and install it on your system. Fortunately, Solarwinds offers a 14 day evaluation period during which you can use the product to its full potential and then decide for yourself if it’s worth it.
Monitoring the Router CPU Load
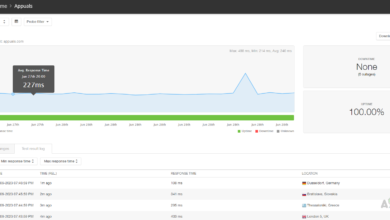
Solarwinds Router CPU Load is a tool that is packed inside the Engineers Toolset using which you will be able to monitor utilization. In order to reduce recurring issues and improve the overall network performance, IT admins need to monitor and analyze the CPU load in the network devices. The tool allows you to monitor the load on various Cisco routers in real-time as well as you are able to record peak CPU level along with the time of occurrence.
A horizontal bar is used to display the current load of CPU for a Cisco router in relation to the maximum CPU load. A great feature in the tool is that if the utilization of memory exceeds a defined value, you will be notified via different colors. If the value satisfies a defined threshold value for warning, the color of the bar will change to yellow while a red color represents critical level.
Analyzing and Monitoring CPU Load in Real-Time
Now that we are done with all of that, we can get into the gist of this article and show you how to analyze and monitor CPU utilization on Cisco devices in real-time. This is very easy to do with the right tool. So, without further ado, let us get into it.
- First of all, open up the Engineers Toolset Launch Pad by opening up the Start Menu and searching for it.
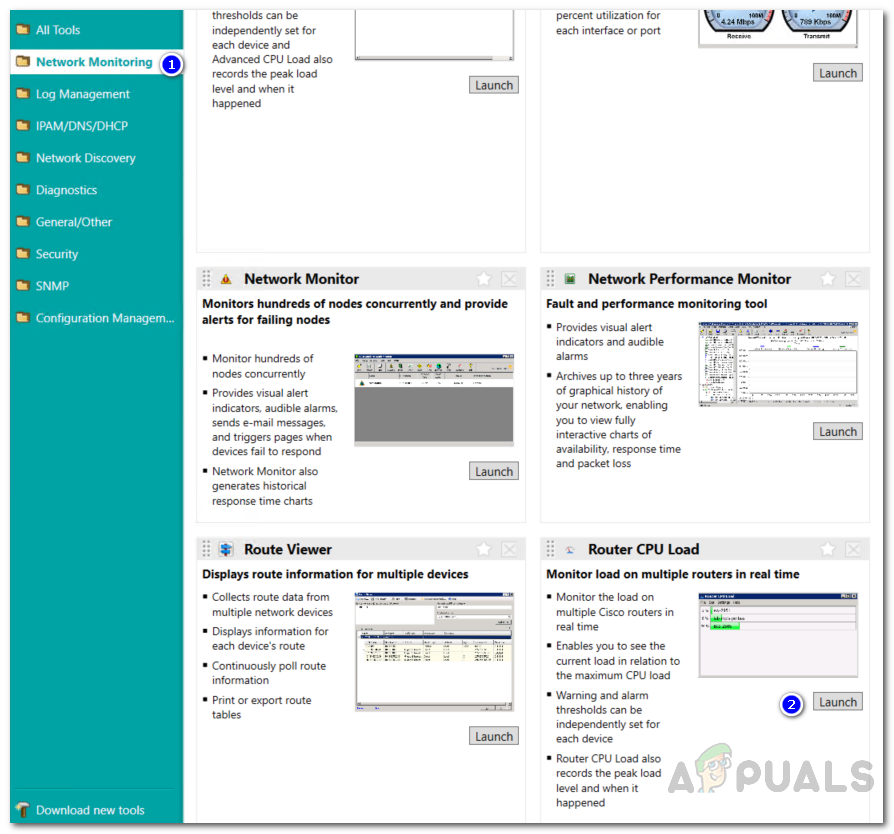
- Once it has opened up, on the left-hand side, go to Network Monitoring and then click the Launch button for Router CPU Load tool. Alternatively, you can just search for the said tool using the search field provided and then launch it up.
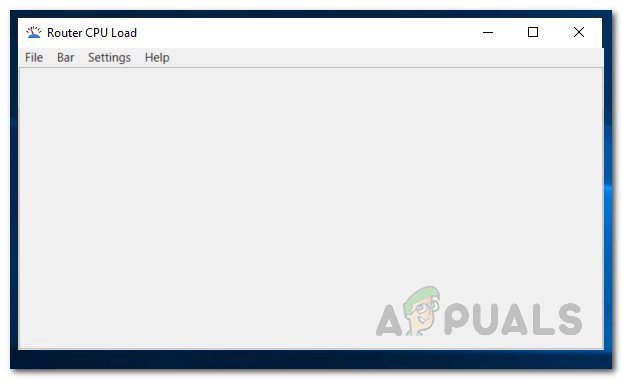
Launching Router CPU Load - After the tool has opened up, you will have to add your device to the tool. To do this, click on the Bar option in the menu bar and then click the Add New CPU Load Bar option.
- Provide the IP address of the target device and then follow it up with the SNMP credentials. You can create a new credential by clicking the option provided and then specifying the details requested. After that, click OK to save your credentials.
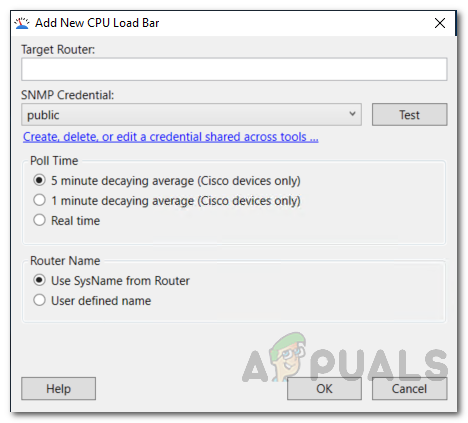
Adding New Device - Make sure to choose the Real time for the Poll Time option and then specify the number of seconds after which the device should be polled.
- Finally, click OK to add your device. Once the device has been added, you will be shown the status of the CPU load.
Setting Custom Alert on Router CPU Usage Spikes
Using Router CPU Load, you can configure thresholds and set up alerts so that you are notified whenever the utilization exceeds a defined value or percentage. To do this, follow the below step-by-step instructions:
- Click on the Settings drop-down menu on the menu bar and then select Settings.
- To set the thresholds, move the slider provided and adjust it per your requirement. You can also change the text of the red level threshold. Here, yellow level means warning and red level represents critical.
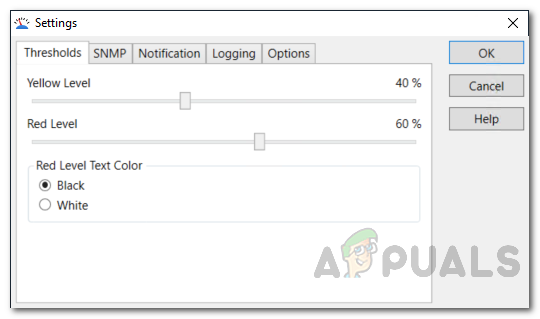
Adjusting Threshold - In order to be notified, go to the Notifications tab. There, you are provided three options. Whenever an alarm is triggered, you can choose to have a sound or a popup or both. Additionally, you can also configure it so that you are displayed custom text by choosing the Open Notification window on alarm option.
- Finally, you can also have the CPU load logged to a file. The Router CPU Load logs the CPU load of the devices and can store it to devices if you want it to. To do so, tick the Logging Enabled option.
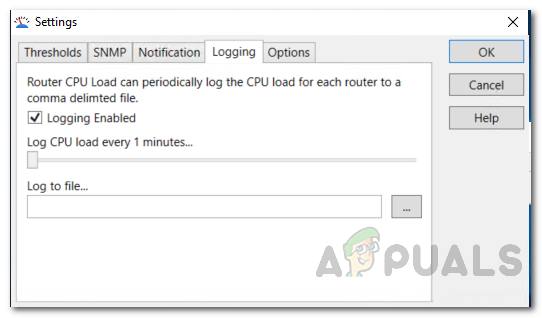
Logging CPU Load - After that, provide the period of time after which the CPU load should be logged. Then, provide a location for the log file where it should be saved. These logs are saved as comma delimited files.