How to Monitor your Server and Applications Using SAM
Servers and applications monitoring was once a fatiguing job back in the day due to the absence of the right tools. Whenever a server faces an issue or is down due to some reason, resolving it before it impacts the users is essential. The competition now, as compared to before, is way bigger and a small delay or an inconvenience can cause many issues including finance. In this computing era, almost all of the activities are being conducted online, from money transfers to communication and trade, everything is digital. That, in itself, is a good thing as it makes things much easier for humans, however, behind the scenes, large sums of data are being received and sent simultaneously. Thus, the importance of monitoring applications and servers has increased drastically.
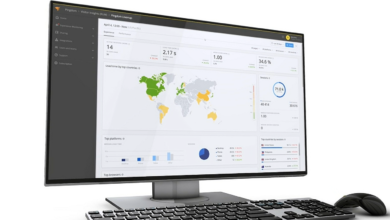
Even though we cannot just magically stop servers from raising an issue from time to time, we can still take the right steps to prevent them from lasting very long. Thanks to the modern era, we now have automated tools for this very reason and once you get them running, you will be able to monitor all your servers and applications from just one screen. This is where Server and Application Monitor or SAM by Solarwinds comes in handy. SAM is a tool developed by Solarwinds Inc which is an American company that provides the necessary tools for system and network management. Among their great products, Server and Application Monitor can be used for comprehensive server monitoring with ease.
Installation of Server and Application Monitor
Before we get into the real deal and start monitoring, you will have to first download and install the software. You can get the tool from here fully functioning for a free 30-day trial. Just fill the in the required blanks and you will be good to go. Once you have downloaded the software, run the .exe file. Solarwinds uses an Orion Installer using which you can install new or upgrade old products. The Orion platform is a suite of Solarwinds products which includes SAM, NPM and many more. Using this, you can navigate through the products, tweak the settings of the products, receive alerts, etc. To install the tool, follow the steps provided below:
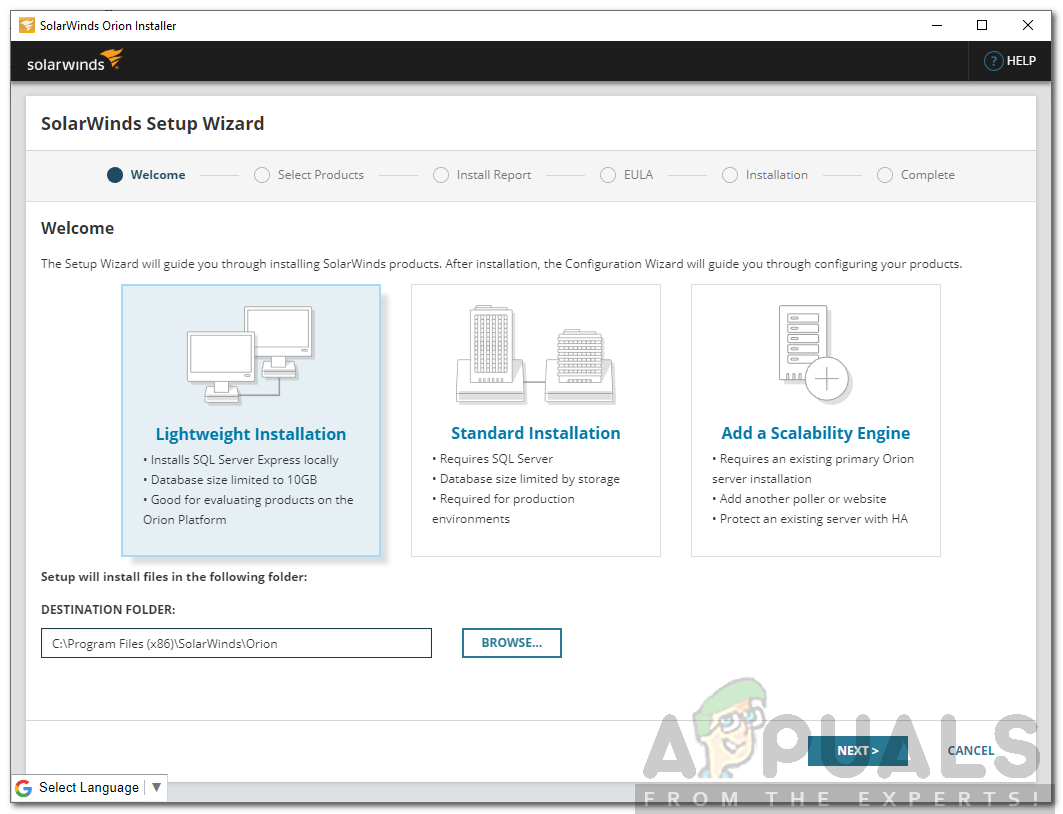
- Once you run the installer, you will be prompted with a UAC dialog box (click Yes) and then an initializing window. This will take a few seconds (up to a minute) before the setup wizard pops up.
- The Solarwinds Setup Wizard will appear once the installer is all set and running. You will be shown three different options with the requisites down below. Select Lightweight Installation.
- Choose where you want to install the software by clicking Browse.
SAM Installation - Once done, click Next.
- Now, you will be able to see the Server and Application Monitor tool already selected for installation. Under Additional Products, other products provided by Solarwinds are mentioned that you can install using this installer. Don’t select anything there, and just hit Next.
- Agree to license and agreement and click Next again.
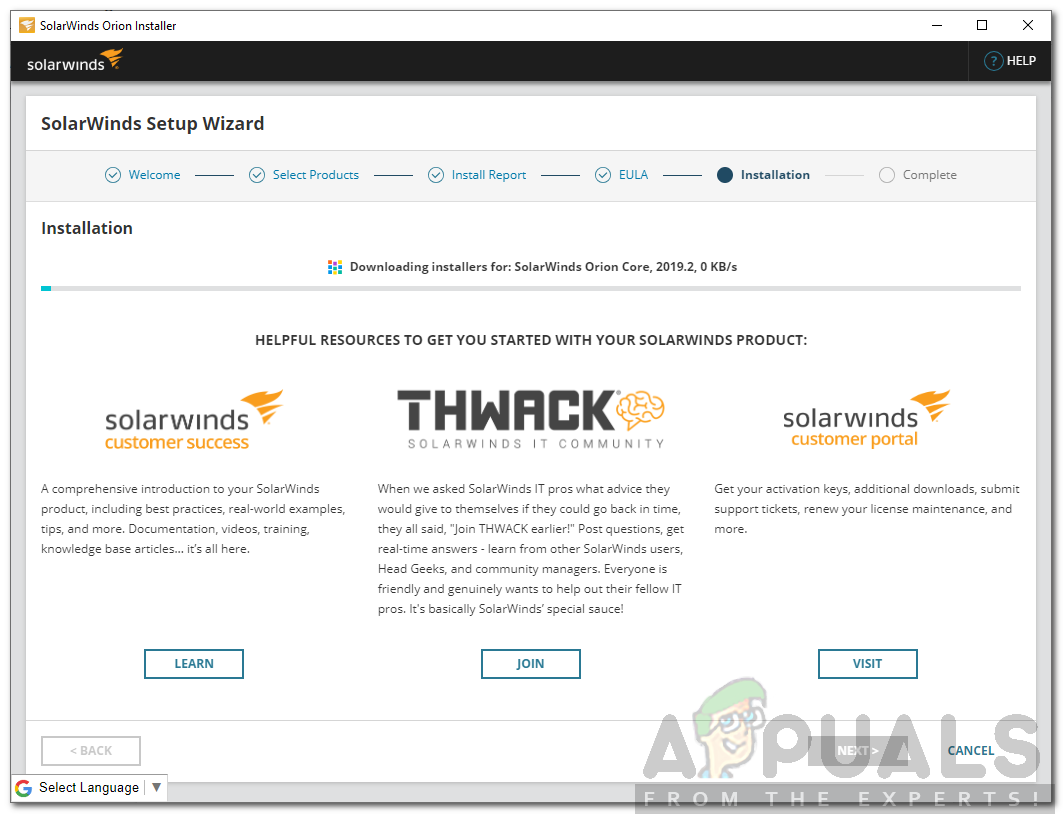
- Wait for it to complete downloading and installing the software. Depending on your internet speed, this might take a while. So be patient.
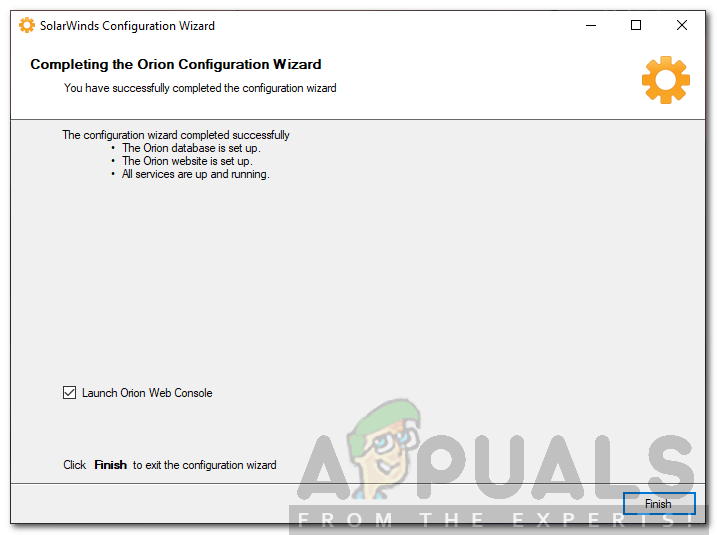
Orion Platform Installing - Once the installation has finished, the configuration wizard will pop up which will automatically configure the database.
- Finally, when the configuration wizard has finished, click Finish.
Solarwinds Configuration Wizard Finished
Monitoring your Server and Applications using Server and Application Monitor
Now that you have downloaded and installed the software successfully, it is time to start monitoring your servers and applications. The procedure might be a little comprehensive but there’s nothing complicated about it. Nonetheless, we will be taking you through each step so there’s nothing to worry about.
Discovering Devices
When you close the configuration wizard by clicking as instructed in the last step above, you will be taken to the Orion web console. Using this console, you will be able to manage all your servers and applications i.e view and configure them. So, let us begin:
- After finishing up the configuration wizard, you will be prompted a web console which is called Orion web console. Here, you will have to first create a password for the admin account. Do that and hit Enter.
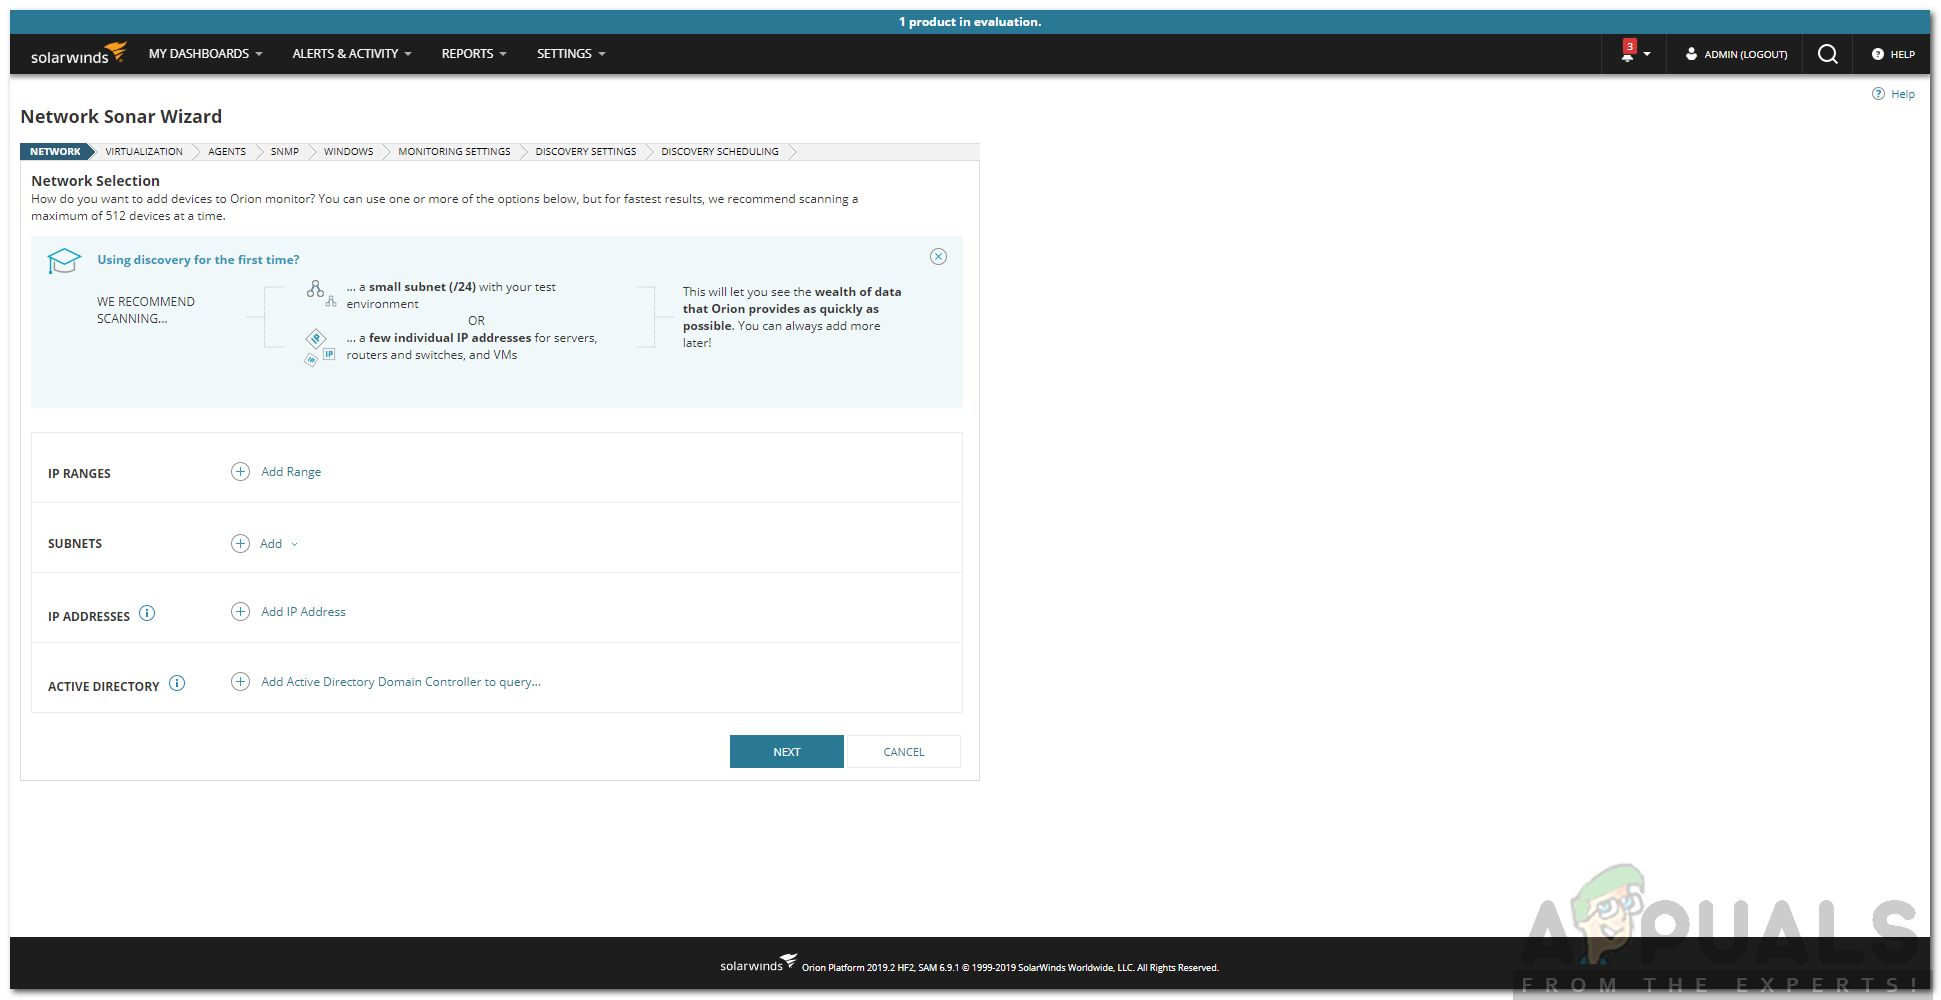
- You will be taken to the Discovery page where you will be able to start monitoring your server and applications. Before you go ahead and click the Start button, it is recommended that you have to be mentioned information about the devices that you want to monitor. First of all, make sure you have the IP addresses or IP ranges along with the login credentials. For further details, please head to the Solarwinds website where they mention the requisites before you start monitoring. It can be found here.
- With that said, click on the Start button.
- Now, you will have to provide the IP addresses or IP ranges of the devices you want to monitor. You can add nodes to SAM using the Active Directory Domain Controller by providing the hostname and login credentials.
Adding Devices - In the Virtualization tab, if you are using a VMware vCenter server, enter the credentials and then hit Next.
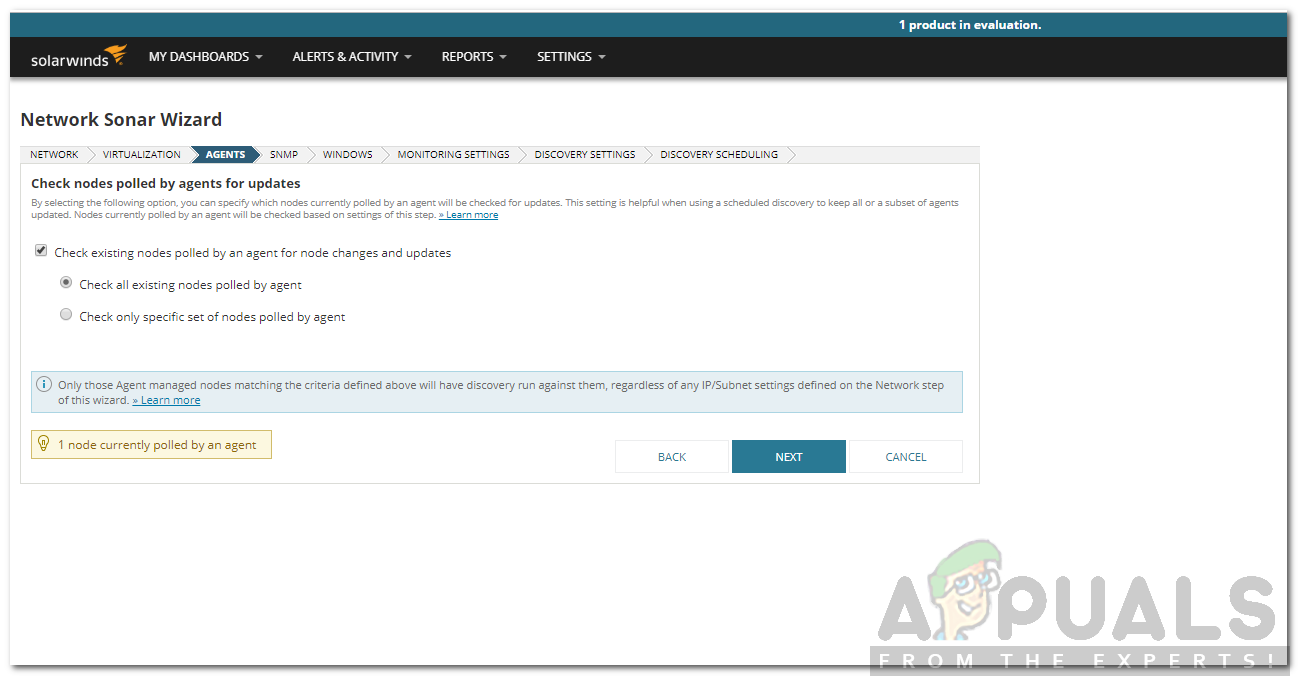
- In the Agents panel, if you have any nodes using agents, make sure the ‘Check all existing nodes polled by an agent’ option is ticked. Click Next.
Network Discovery Wizard - Now, in the SNMP tab, if you wish to monitor any SNMP-enabled device, enter the required credentials and then hit Next.
- In the Windows panel, add a new credential to discover WMI Windows devices. Then, click Next.
- Now, under Monitoring Settings, you are able to choose the polling method (choosing WMI over SNMP does not mean it will not also poll using SNMP, it just means that it will first do it using WMI and then SNMP) and then provided an option of manually selecting what to monitor on the devices or let the software choose automatically as per your defined monitoring settings. Solarwinds recommends monitoring Windows devices via WMI instead of SNMP. Select ‘Automatically monitor based on my defined monitoring settings’ so that you get an idea of how it works. You can also select ‘Manually set up monitoring after devices are discovered’ to do so what is mentioned in the next steps after the devices are discovered.
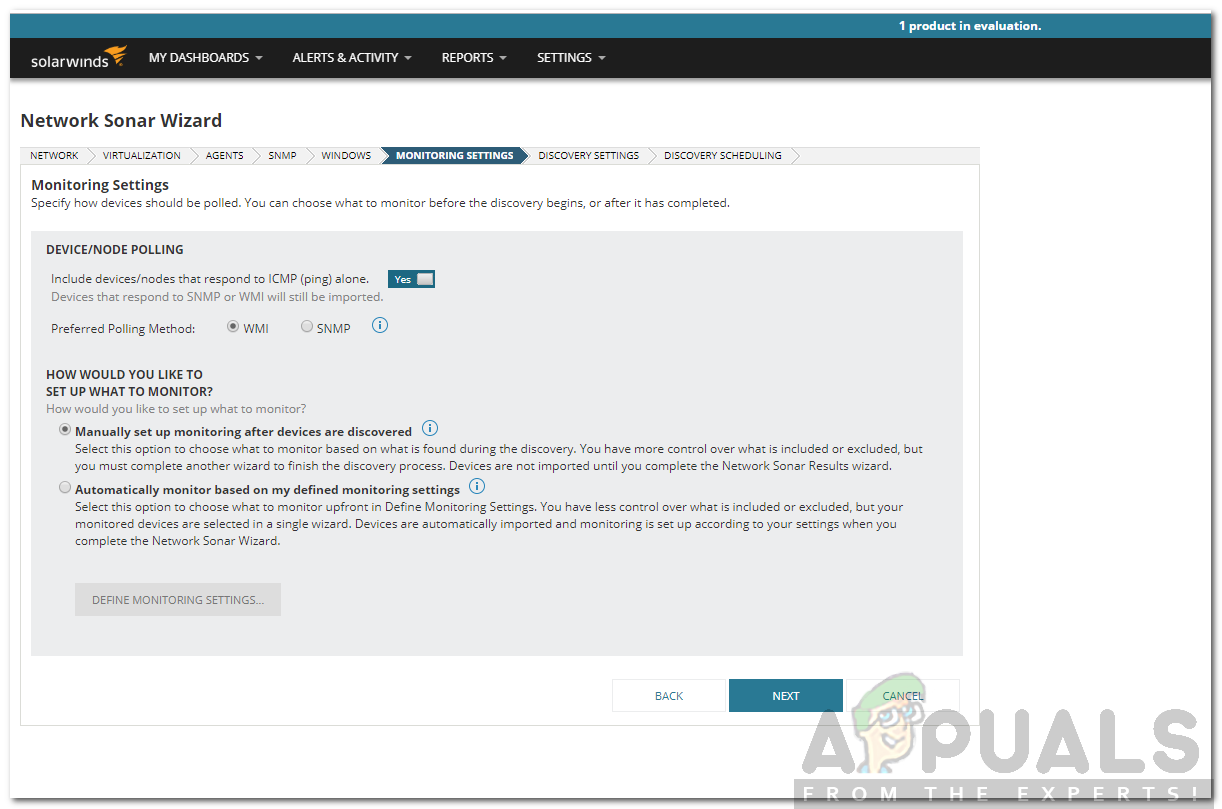
Monitoring Settings - Click on Define Monitoring Settings. Hit Next.
- In the Interfaces tab, select the Status, Port Mode and hardware of the devices you want to monitor. Under Advanced filtering options, you can add specific phrases or keywords that the software will look for in the specified column (i.e Interface type, name, etc.).
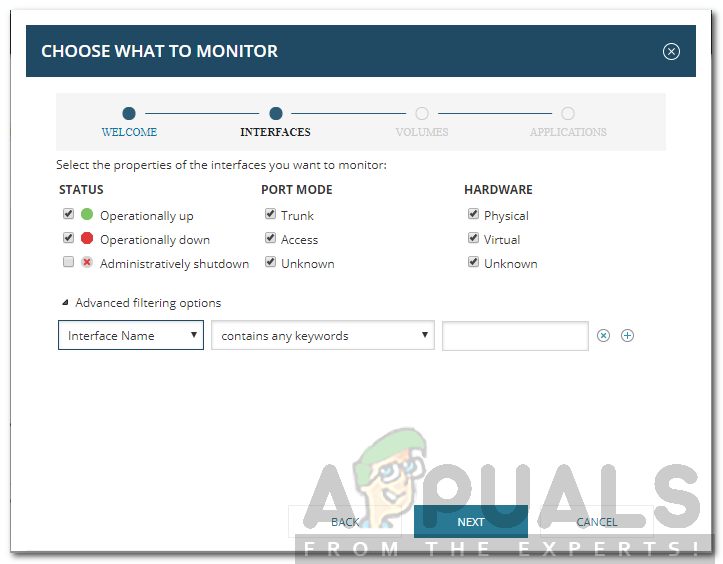
Defining Interface Settings - Afterward, select the types of volumes you want to monitor. After that, select the applications you want to monitor and click Finish.
- Now, click on Next.
- In Discovery Settings, simply click Next.
- You can change the Frequency to discover devices after the selected frequency.
- Finally, click on Discover and wait for it to complete discovering the networks. This can some time depending on the number of devices that you added.
Adding Discovered Servers and Applications to SAM
If you had selected the ‘Manually set up monitoring after devices are discovered’ option, you will now have to set up monitoring settings. If you selected the automatic option, the device has already been added to SAM. Thus, this section is only if you selected the manual option. Once you discovered the servers or devices that you want to monitor using the Discovery wizard, it is time to add them to Server and Application Monitor. After doing so, you will be able to monitor the servers and applications. Here’s how to do it:
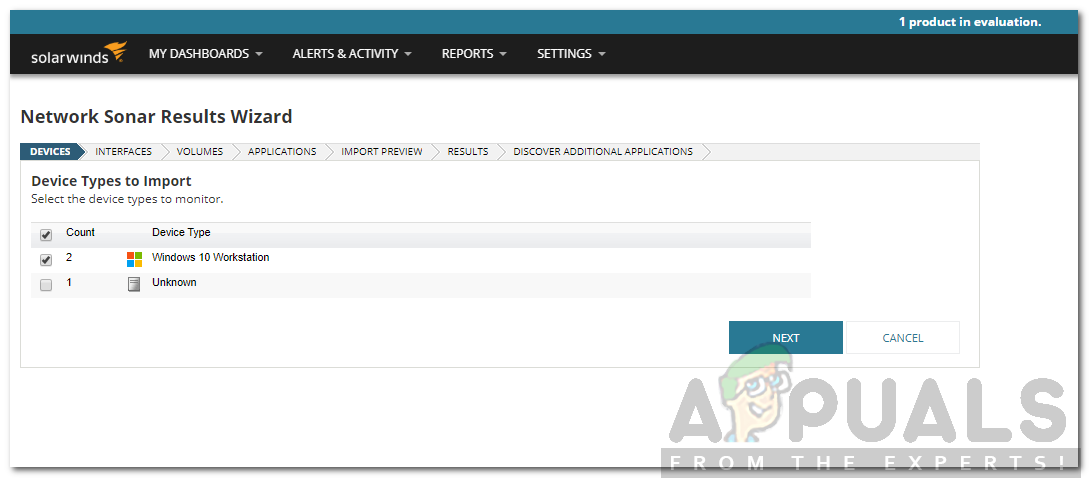
- Once the discovery process completes and the Result wizard appears, select the devices that you want to monitor and click Next.
Discovered Devices - Now, select the interfaces you want to monitor and click Next.
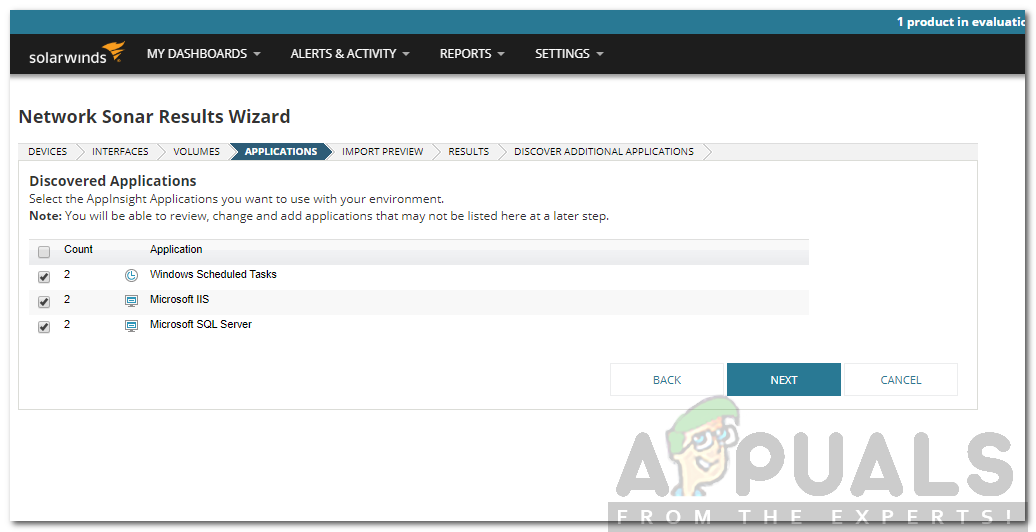
- After that, select the volume types to monitor and then followed by the applications.
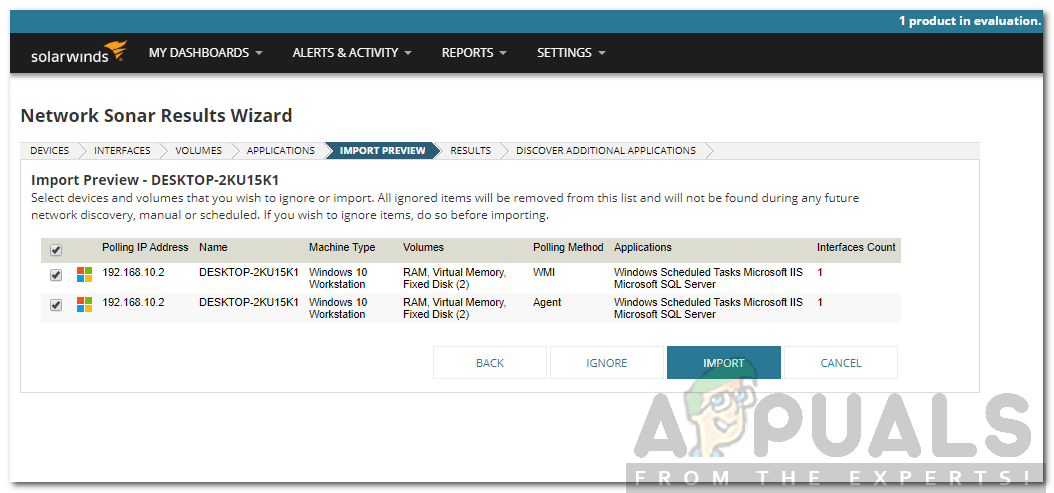
Applications Selection - In the Import Preview tab, review the device that is to be imported and then click Import.
Importing Device - Click Finish in the Results tab.
- You have successfully added your device to SAM.
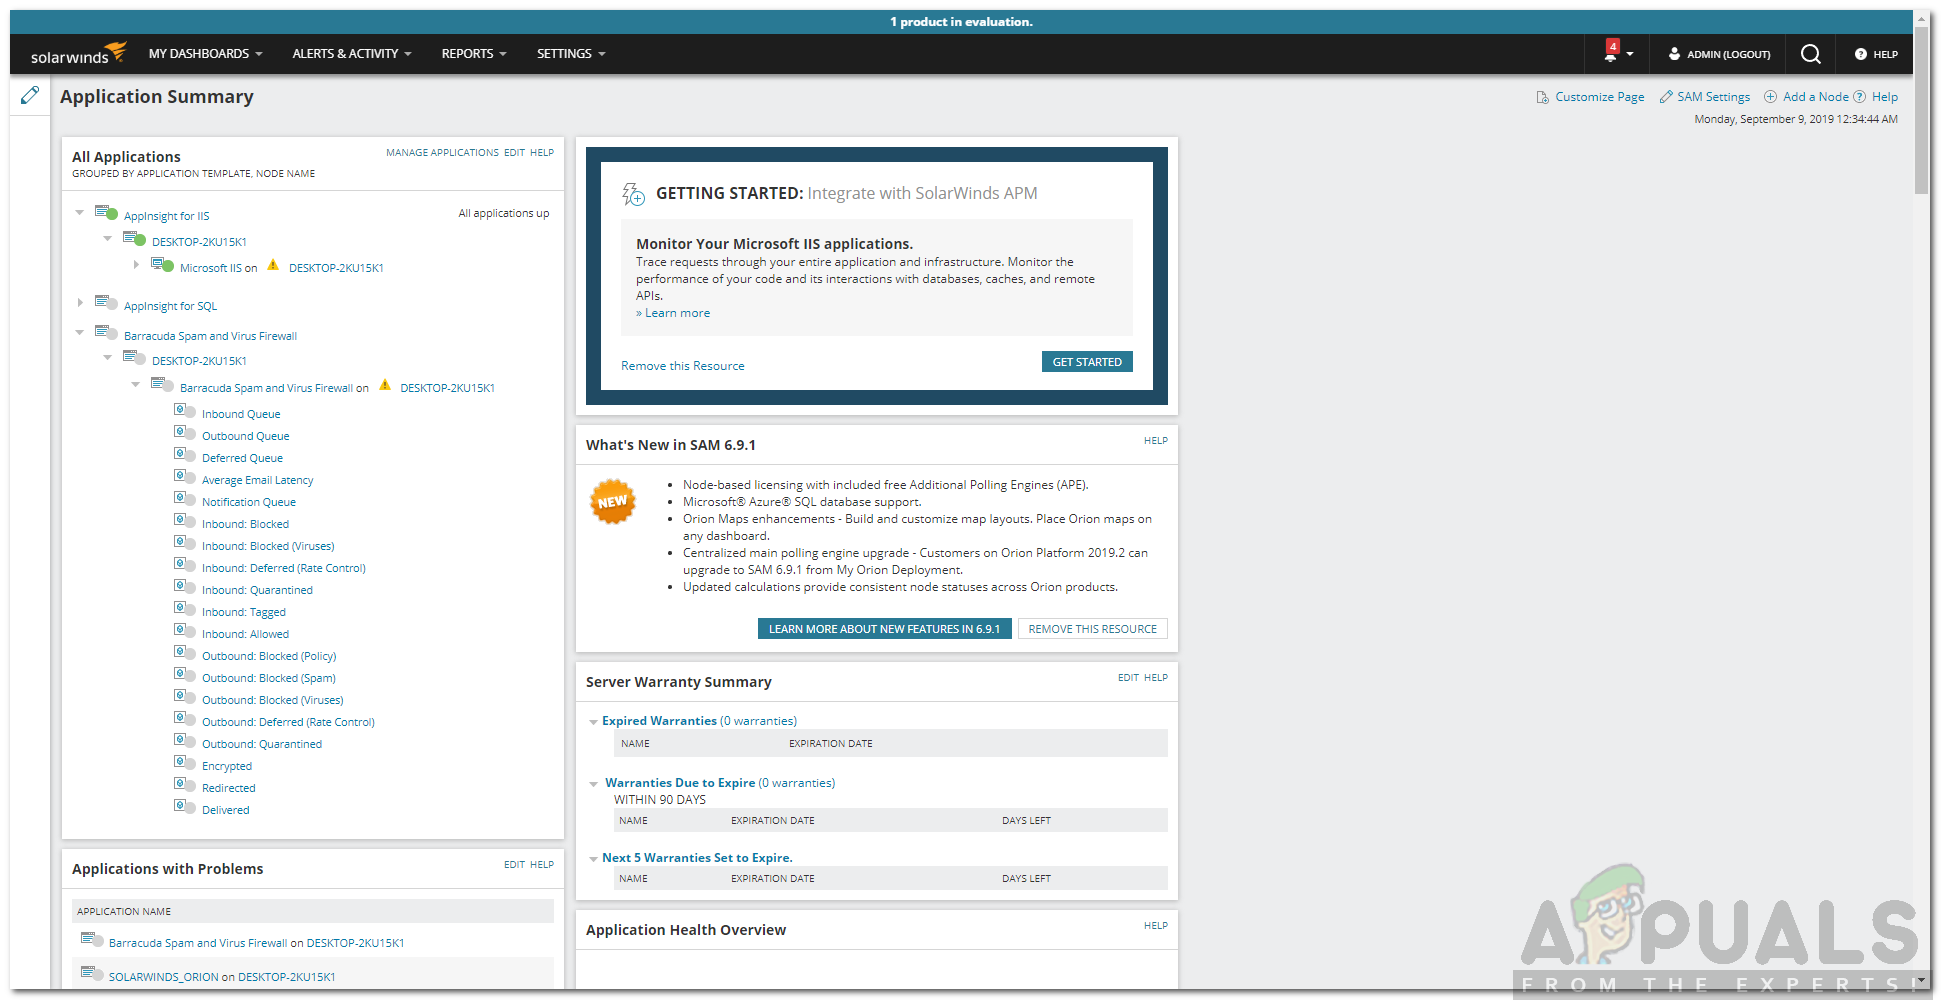
- Go to My Dashboard > SAM Summary to view the added devices.
Monitoring the Devices
After adding the devices to SAM, you can now start monitoring them. Server and Application Monitor comes up with hundreds of templates that you can use to monitor applications and servers. Now, if you want to add a template to a node, here’s how to do it:
- Click on Settings > All Settings and then go to SAM Settings.
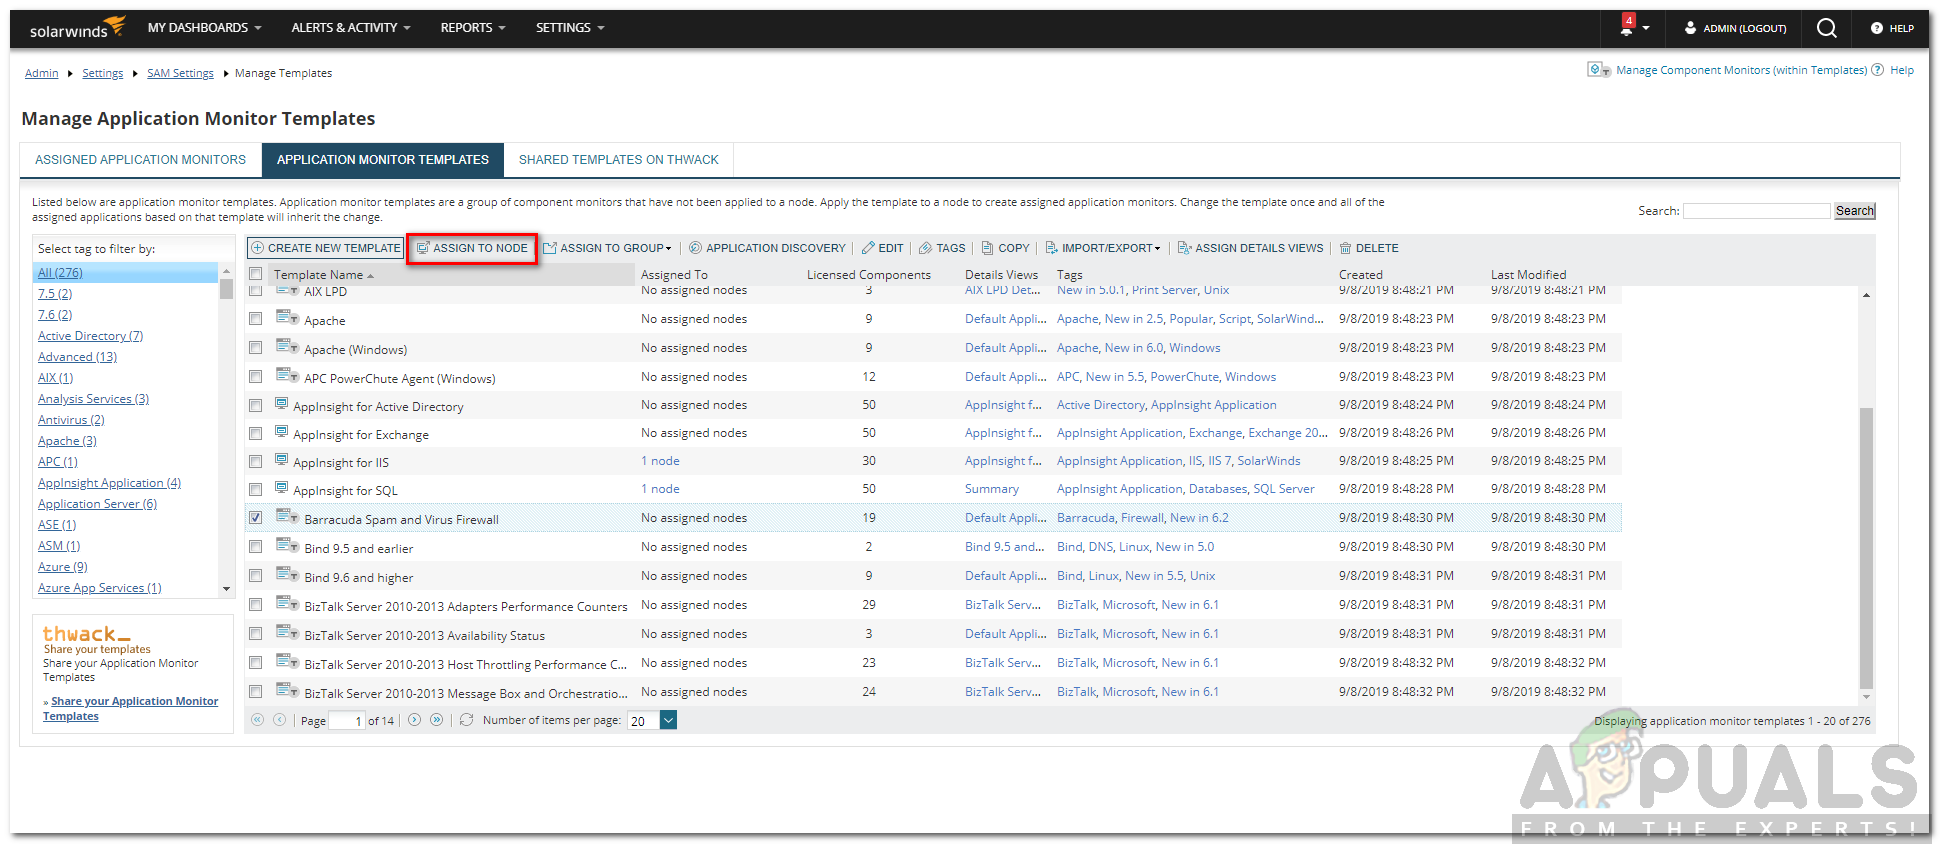
- Under Application Monitor Templates, click on Manage Templates.
- Choose the template you want to add and click on Assign to Node.
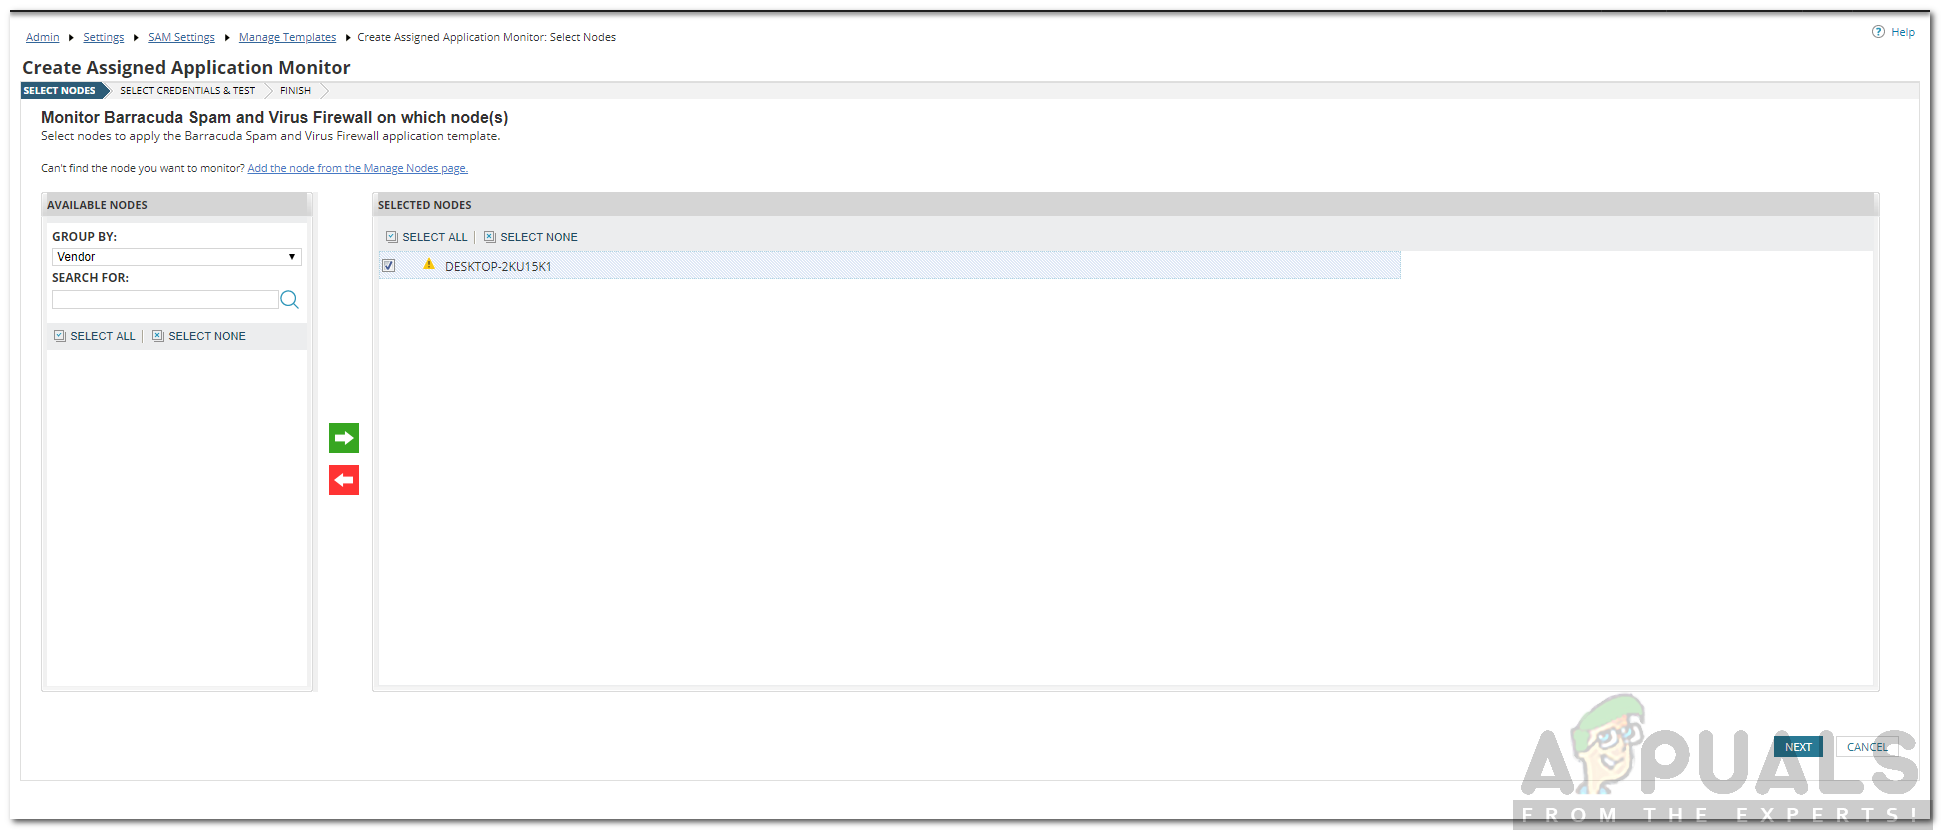
Assigning a Template - Select the node in the left pane and then click on the green arrow to move it to the right pane. Select the node in the right pane and click Next.
Applying a Template - Now, you will have to choose the credentials. Do so, and then click on Assign Application Monitors.
- Lastly, on the Finish panel, hit Done.
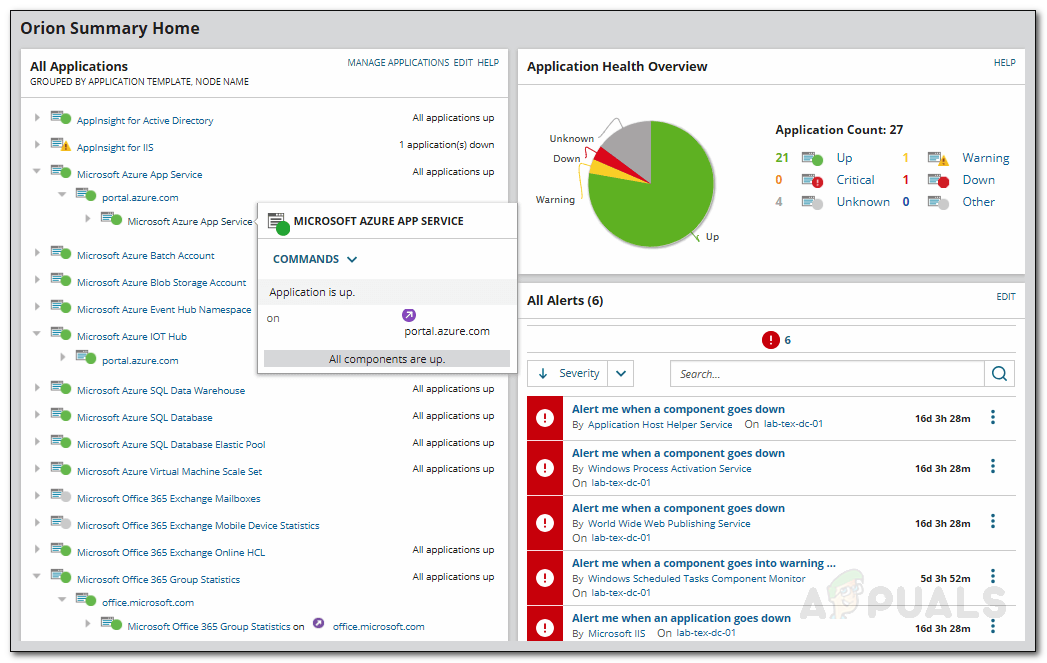
- Once you click Done, it will take you to the SAM Summary page where you can see the template. The data will take a few minutes before being displayed.
SAM Summary