‘Analyze Memory Utilization in Realtime on Network Devices’
Memory is one of the main components of computer systems. Gone are the days when computers used to have megabyte or kilobytes of memory. That was enough for its own period, however, in modern computers, we are running multiple processes and applications at the same time which require more memory to be utilized. That is why, the amount of memory in a device is increasing drastically per the modern requirements.
One of the most common mistakes that we make is that whenever a device isn’t performing up to its potential, more memory is added. Adding more memory is not going to do you any good if your device isn’t optimized and thus, it will just keep on with its sagging performance. Network and system administrators should know that optimizing a device’s memory is not just adding more to it. We are all aware of the saying that adding more RAM to your system will boost the performance. While this stands true and tall in most of the cases, there are scenarios where it will not be applicable.
Memory utilization as well as CPU load is an important factor while trying to optimize a network performance. IT admins have to ensure that the memory utilized is not being wasted in some random process that is not going to benefit the network performance in any way whatsoever. To ensure optimum network performance and reduce the amount of problems that may arise in a network, the memory utilization of the devices and routers present in the network has to be monitored. We will be showing you how to do this in this guide, so just follow through and you will be good to go.
Downloading the Memory Monitoring Tool
There are tons of network tools and utilities available on the internet that lets you monitor the memory utilization of your network devices. However, there is a product that tops every such list. Not only does it let you monitor memory utilization in your network, you can discover your network and scan for IP addresses in your network.
Solarwinds Engineers Toolset (download here) is a network software that helps you in your day to day networking. The product features more than 60 tools that can be used for different purposes. From network discovery to diagnostics tools to log management to config management, Engineers Toolset has everything that you will ever need while managing and troubleshooting a network.
That is why, in this article, we will be using one of the tools packed inside ETS. Therefore, you will have to download the tool from the link provided above and then install it on your system. You can download the evaluation period of 14 days provided by Solarwinds to check out the product for yourself and make a decision. The installation process is pretty simple and can be dealt with via a few clicks only.
What is the Memory Monitor Tool?
Memory Monitor is one of the tools bundled with the Solarwinds Engineers Toolset. The object of the tool is pretty obvious and simple. With the help of Memory Monitor, you will be able to monitor the memory utilization of your network devices which can be really helpful while optimizing your network for better performance as memory plays a vital role there.
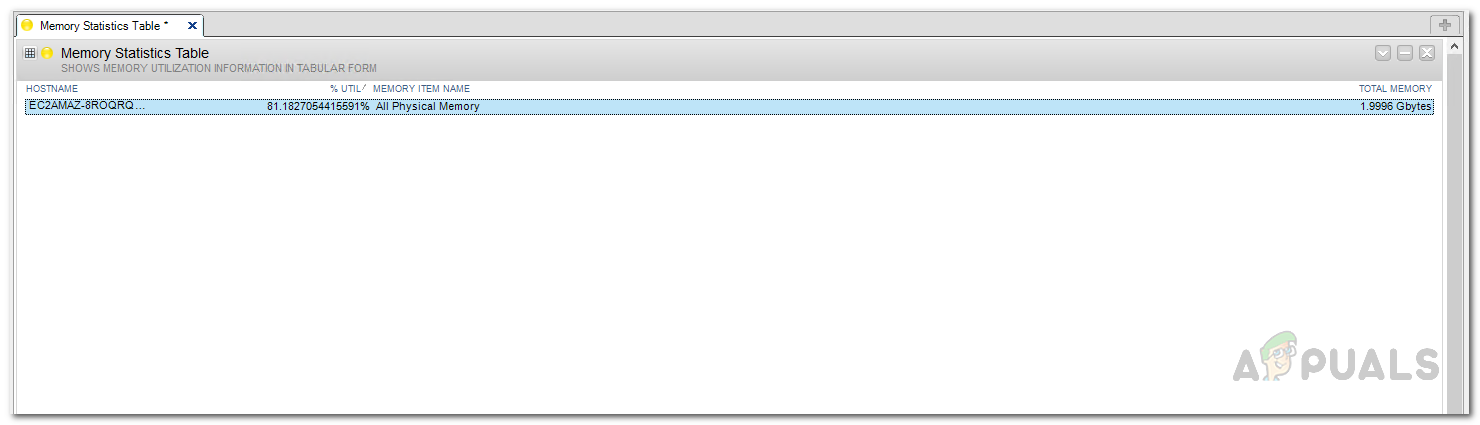
The data can be represented in different formats which includes gauge, table and more. With the help of the tool, you will be able to monitor memory utilization in your network devices in real-time as well as see the data in a tabular form along with the total available memory. It is a clean little tool that does the job it is supposed to quite easily.
Monitoring and Analyzing Memory Utilization in Real-Time
Once you have installed the Engineers Toolset tool in your system, you will be able to use the Memory Monitor tool. The tool is located inside the Workspace Studio, so you will not find it in the All Tools or other respective tools categories. Follow the below given instructions to keep an eye on the memory utilization of your network devices.
- First of all, you will have to open up the Engineers Toolset. To do this, open up the Start Menu and type in Toolset Launch Pad. After that, press the Enter key or just click on the tool listed under Best Match.
- Once you have opened up the toolset launch pad, you will have to launch the Workspace studio. To do this, just search for Workspace Studio in the search field provided and then click the Launch button.
Launching Workspace Studio - After that, you will have to add your devices to the Workspace Studio. To do this, click on the plus (+) in front of Devices on the left-hand side. Provide your device IP address and then follow it up with the SNMP credentials or community strings.
Adding New Device to Workspace Studio - Now that you have added your device to the tool, you will have to drag and drop the Memory Monitor tools to create a tab. The tools are located under CPU and Memory.
- For the sake of the article, we will be using the Memory Table and Memory Chart tools. Drag and then drop them in the middle window.
- After that, you will have to add your devices to the tools. This is very simple as well. Just click on your device under the Devices heading on the left-hand side and then drag it to the tools.
- The data will be collected and you will be shown the results in a few seconds.
Populating Memory Monitor with Devices - You can change the defined threshold values if you wish to by clicking the drop-down menu icon on the tool and then going to Gadget Settings.
- After that, navigate to the Edit Thresholds tab. There, you will be able to see the default values for warning and critical. If you want to change them, just click on the respective threshold and define a value per your requirement.
- You can also add new data columns to the Memory Table tool through the Edit Table Columns tab. Other than adding, you can remove any existing columns by selecting the column name and using the left arrow button.
- The same process is to be followed for Memory Chart and Memory Gauge tools as well.