Troubleshoot Network Latency Issues with SolarWinds NPM
 Reviewed by Muhammad Zubyan
Network latency can be caused by various reasons such as network congestion, bandwidth limitations, and distance, among others. It can lead to various issues such as slowing down application performance, user interactivity, data transfer, and financial transactions. Hence, network latency needs to be addressed before it causes any major problems.
Various manual methods like PING, traceroute, and Network Performance Monitoring tools are available to identify network latency. Among these, the SolarWinds Network Performance Monitor (SolarWinds NPM) stands out as an exceptional tool for identifying network latency. Network administrators can easily identify performance-related issues before users notice them, using the Network Latency Test tool available in SolarWinds NPM. Additionally, SolarWinds NPM’s advanced alerting feature allows network administrators to trigger alerts whenever there’s a decline in network performance or an increase in Network Latency.
In this article, we will discuss the features available in SolarWinds NPM to identify and troubleshoot Network Latency. Click on this link to learn more and download SolarWinds to try its features.
Response Time Monitoring
Response time is one of the factors that contributes to network latency. Longer response times lead to latency in the network because data takes more time to travel back and forth between the source and destination, which may result in severe issues, particularly in high-frequency production environments. Therefore, it is essential to monitor response time.
SolarWinds NPM features intelligent response time monitoring that detects and alerts whenever the response time breaches the threshold limit we set.
Follow the below steps to monitor the response time for any device in the environment.
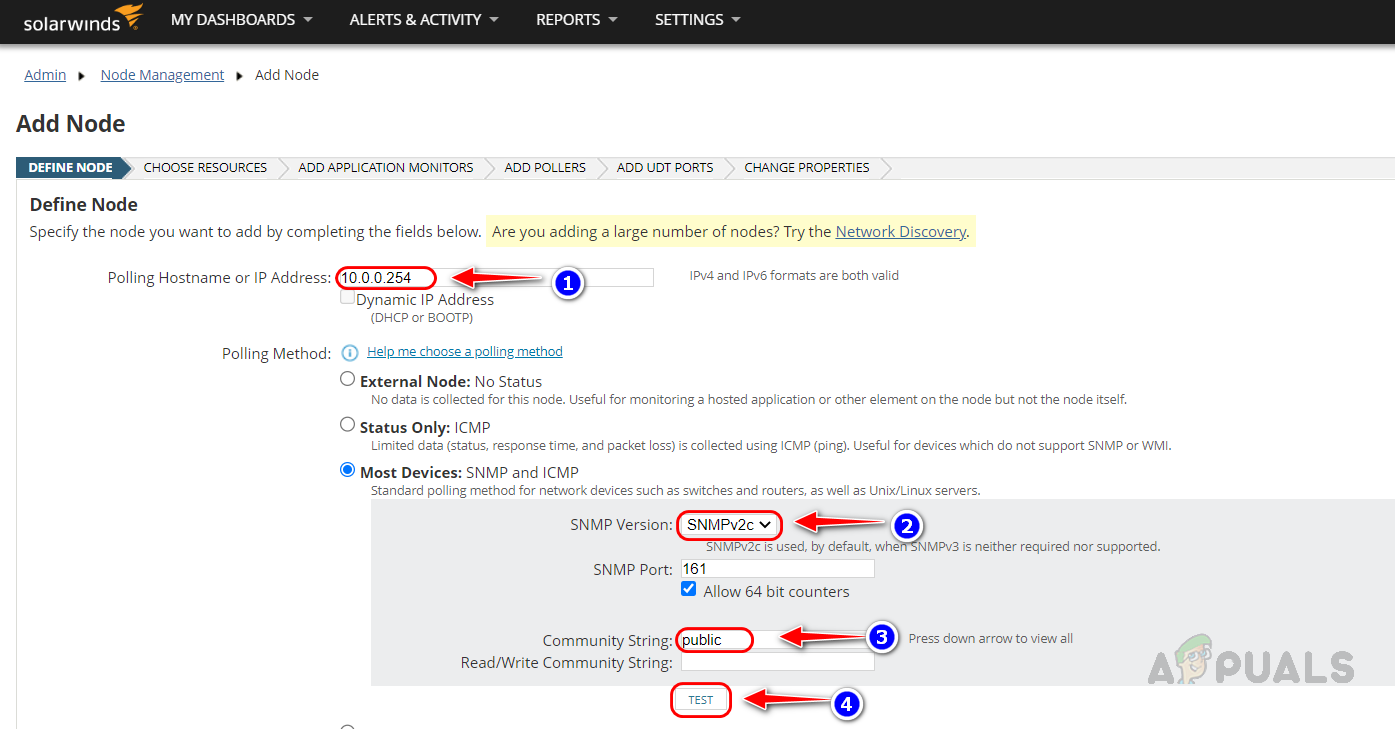
- First, we need to add the device to SolarWinds. To do this, enter the IP Address or hostname of the device that you want to monitor. Then, select the SNMP version and provide the community string if it is v1 or v2. If it is v3, you need to provide the authentication method and its password, as well as the encryption method and its password. Once these details are provided, click on ‘test’. You should then receive a ‘Test Successful’ message.
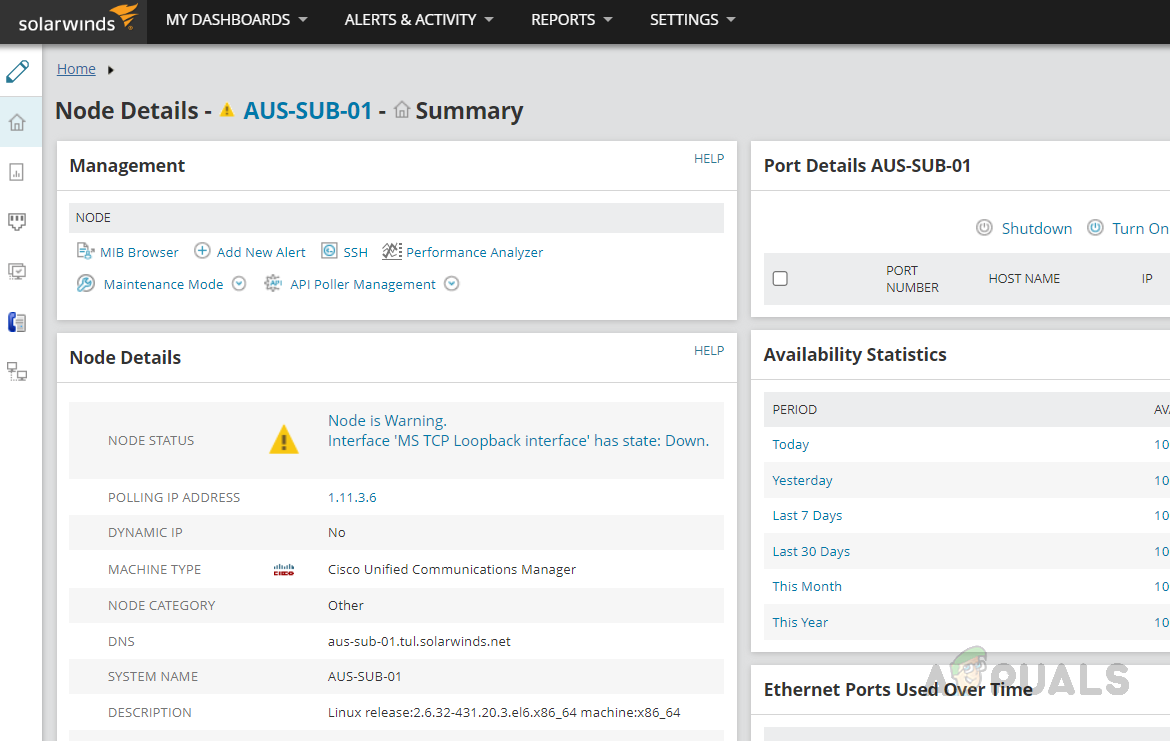
- Once the device is added to monitoring, open the device from the Solarwinds summary page or from the Manage Nodes page.
- Click on Vital Stats from the left navigation menu.
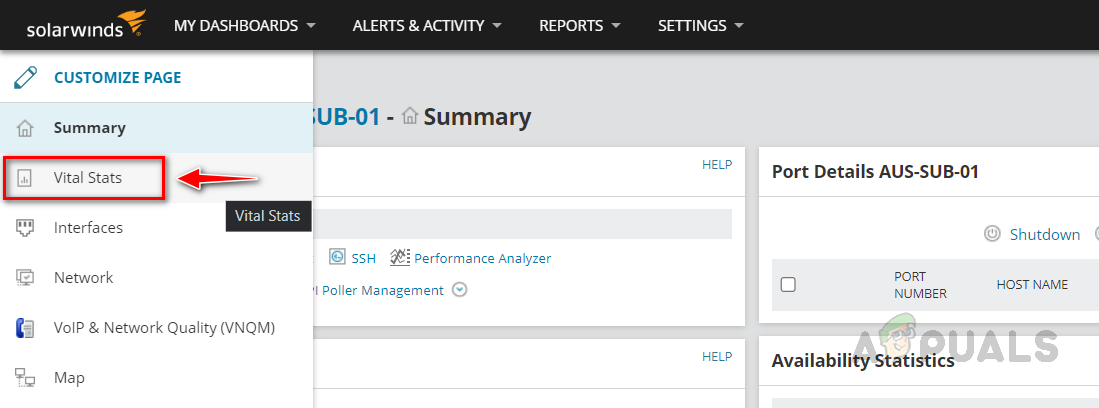
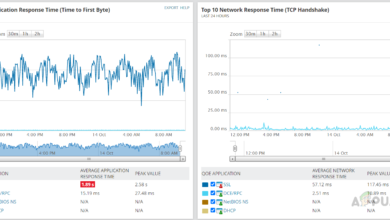
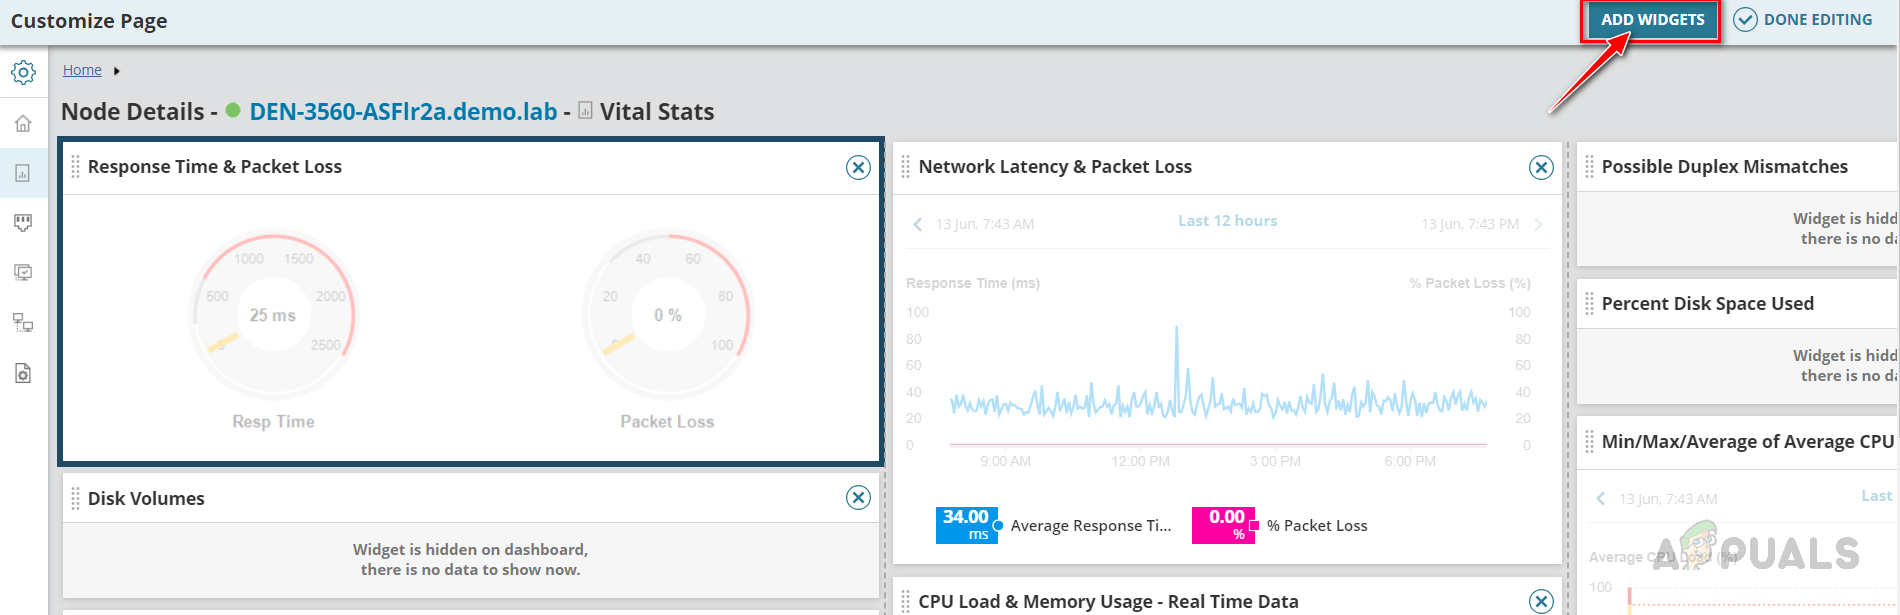
- You can see the current response time as well as Network Latency data for the Last 12 hours based on the response time data of the device.
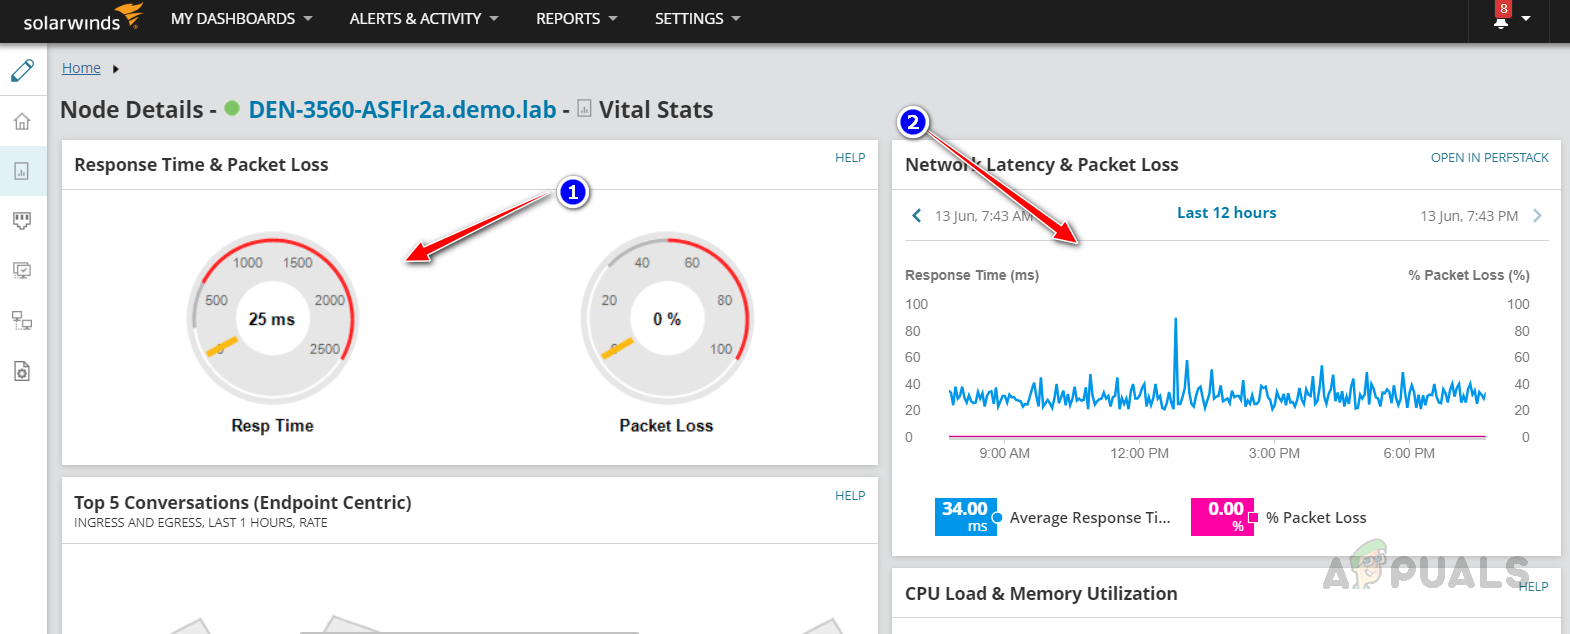
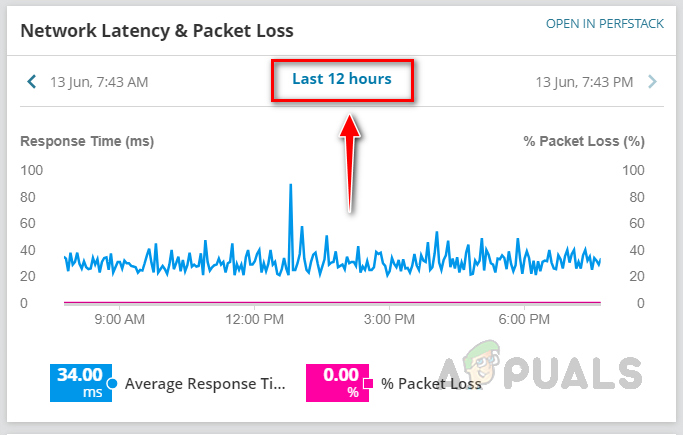
- This Network Latency widget is an interactive dashboard. You can change the duration of the historical data that you want to view on this widget.
- To change the duration, click on Last 12 hours.
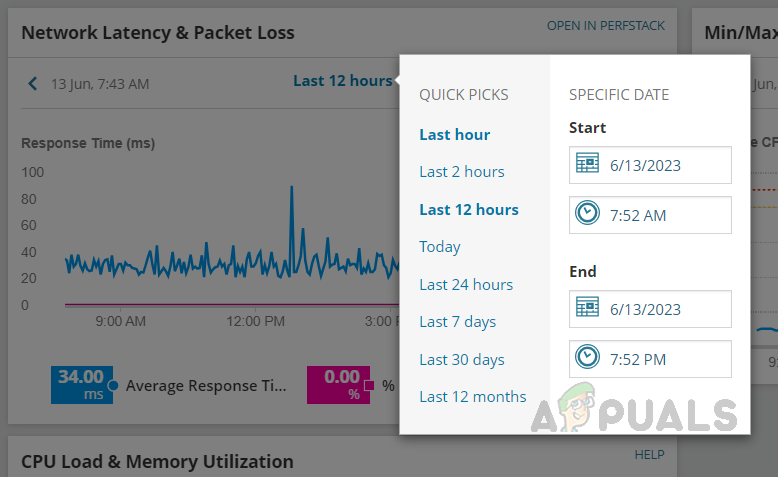
- Select the duration you want to view on this widget from the Quick Picks option or you can use custom duration using the Specific Date option.
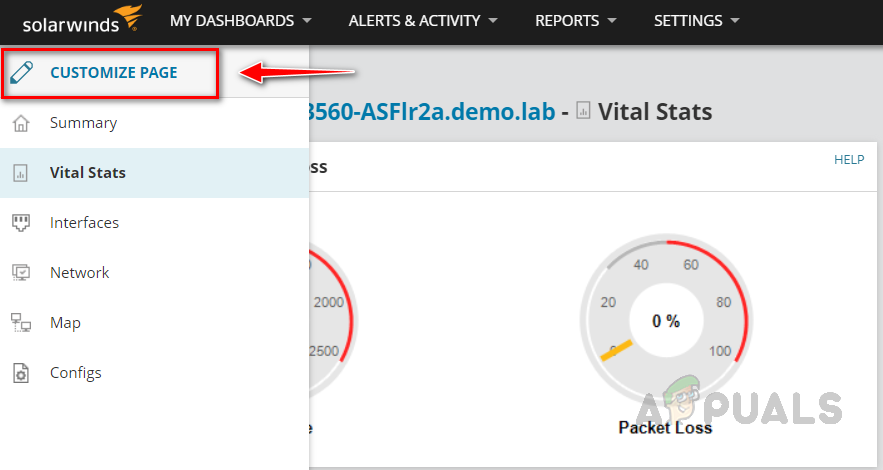
- If you are unable to see this widget, you can add it to your dashboard through the Customize Page option.
- To add this widget, click on Customize Page from the left navigation pane.
- Click on Add Widgets.
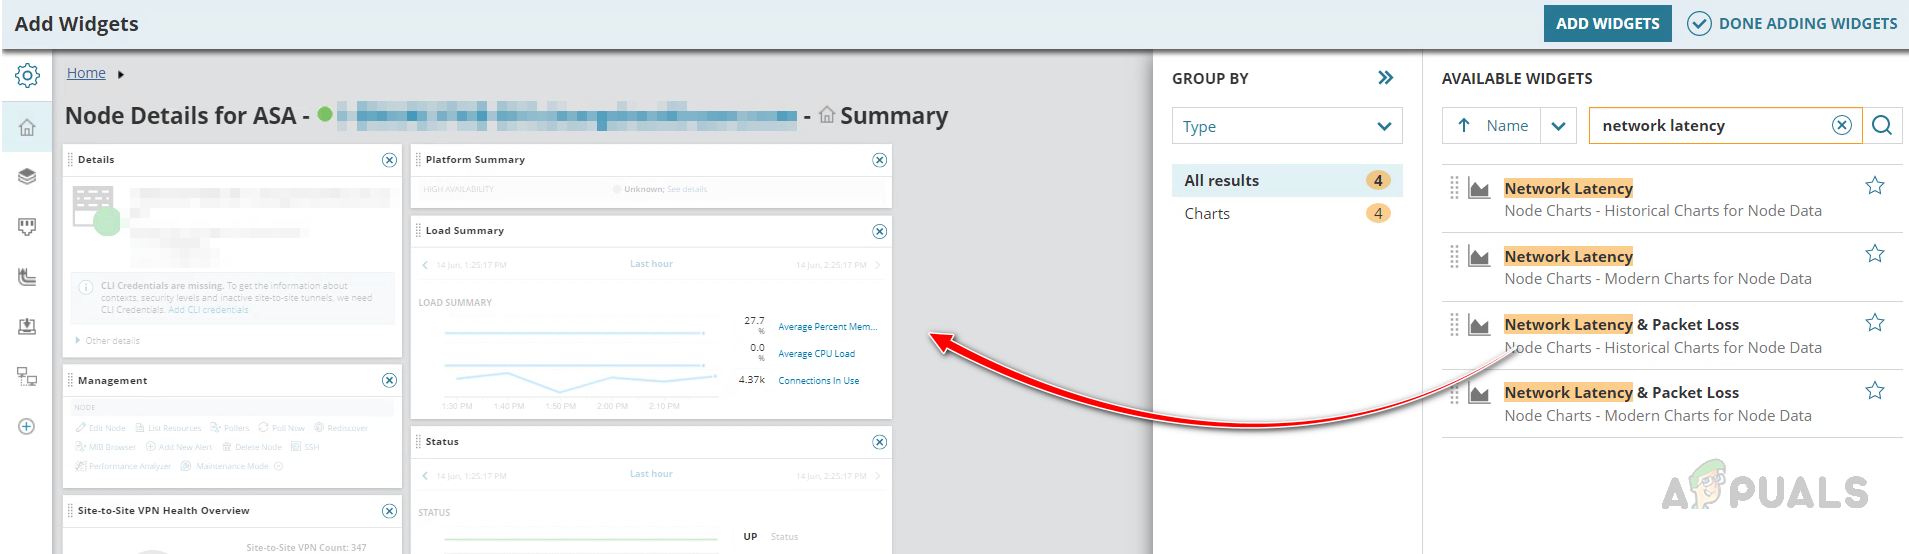
- Search for Network Latency in the search box.
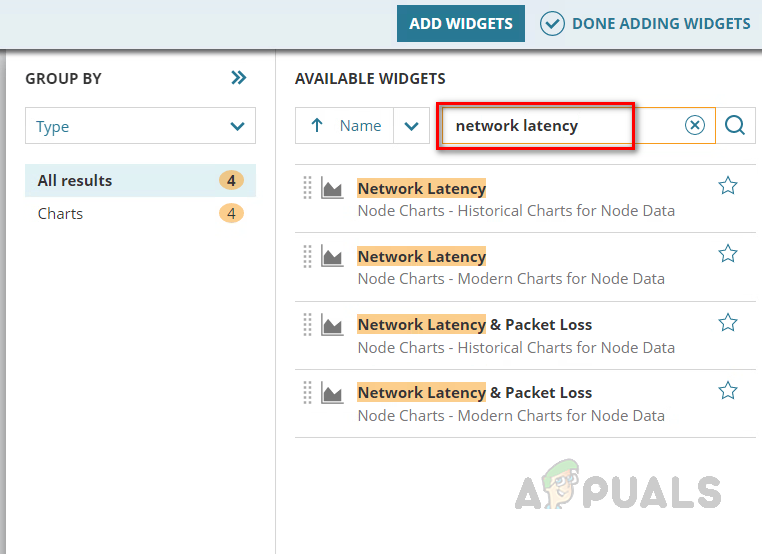
- Drag and drop the Network Latency & Packet Loss widget from the search results.
- Using these data you can review the current and historical response time of any device.
Now, let’s see how to configure an alert for response time for any device in monitoring.
Configuring Alert for Response Time
If you are new to SolarWinds or Alert configuration, check the article Using Solarwinds Advanced Alerts to Manage Network Issues to learn how to configure alerts in detail.
Follow the below steps to configure alerts based on device response time.
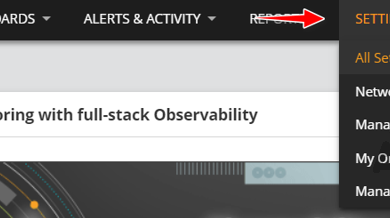
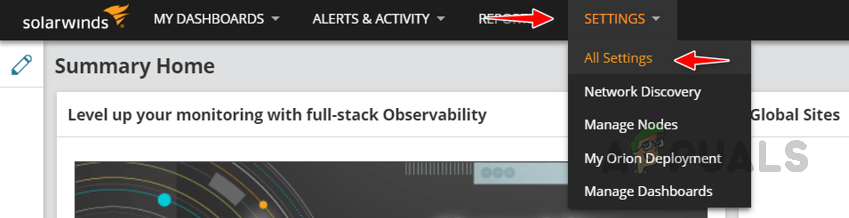
- Go to Settings and then All Settings.
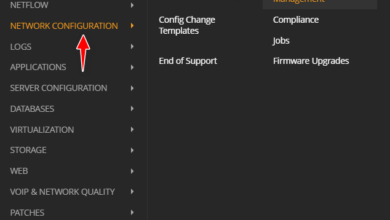
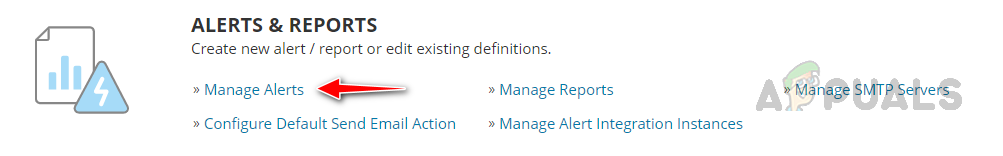
- Click on Manage Alerts under Alerts & Reports.
- Click on Add New Alert.

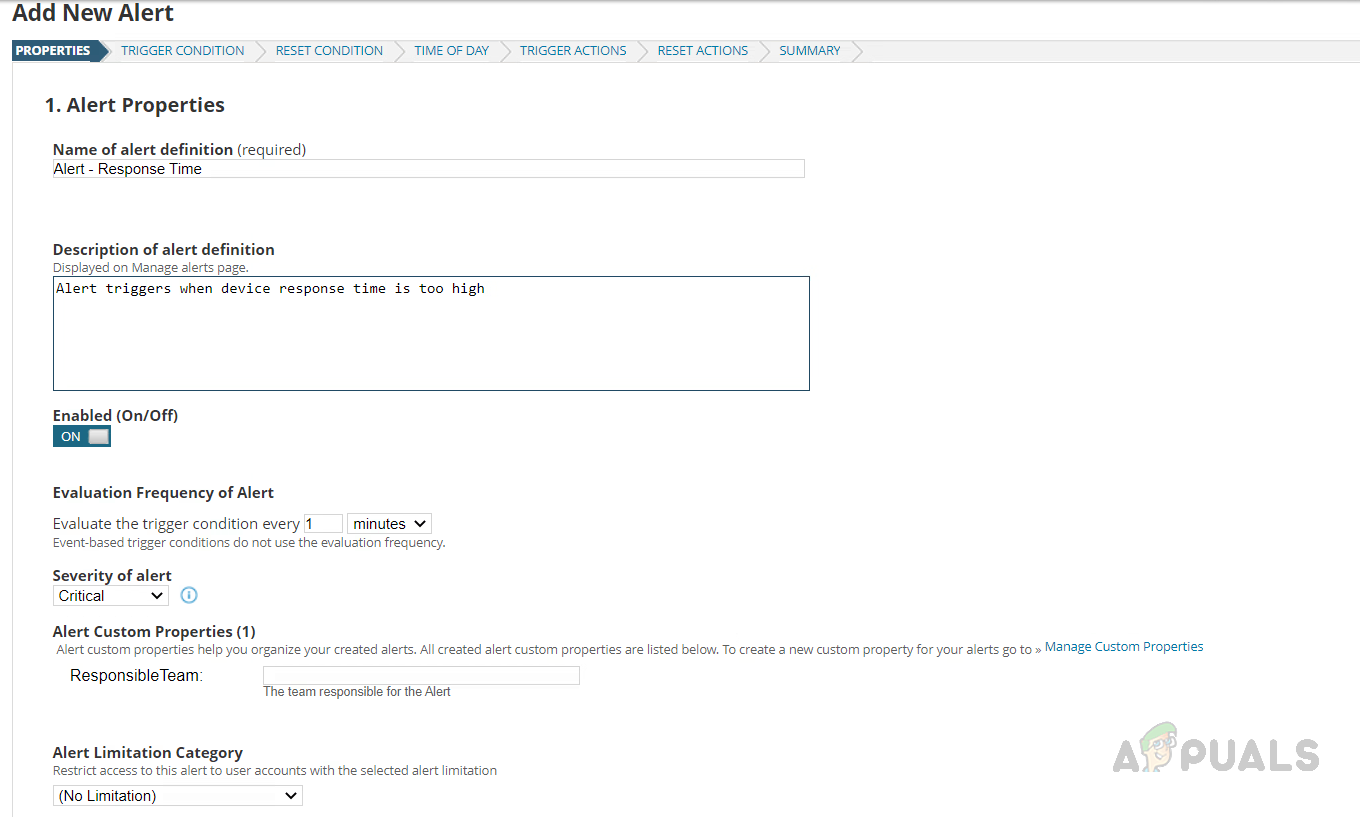
- Provide an appropriate name and description for the alert. Select the required evaluation frequency and severity for the alert.
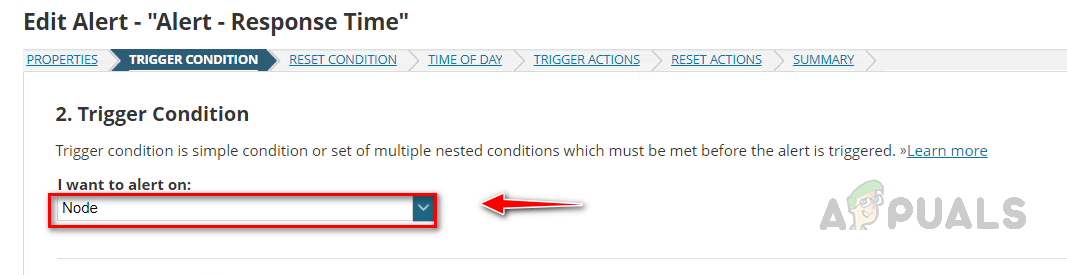
- Select Node from I want to alert on the drop-down list.
- Set up the below alert condition, you can increase and decrease the response time threshold as per your environment. Alert triggers whenever the response time goes beyond 200 ms and the node should not be in down status.
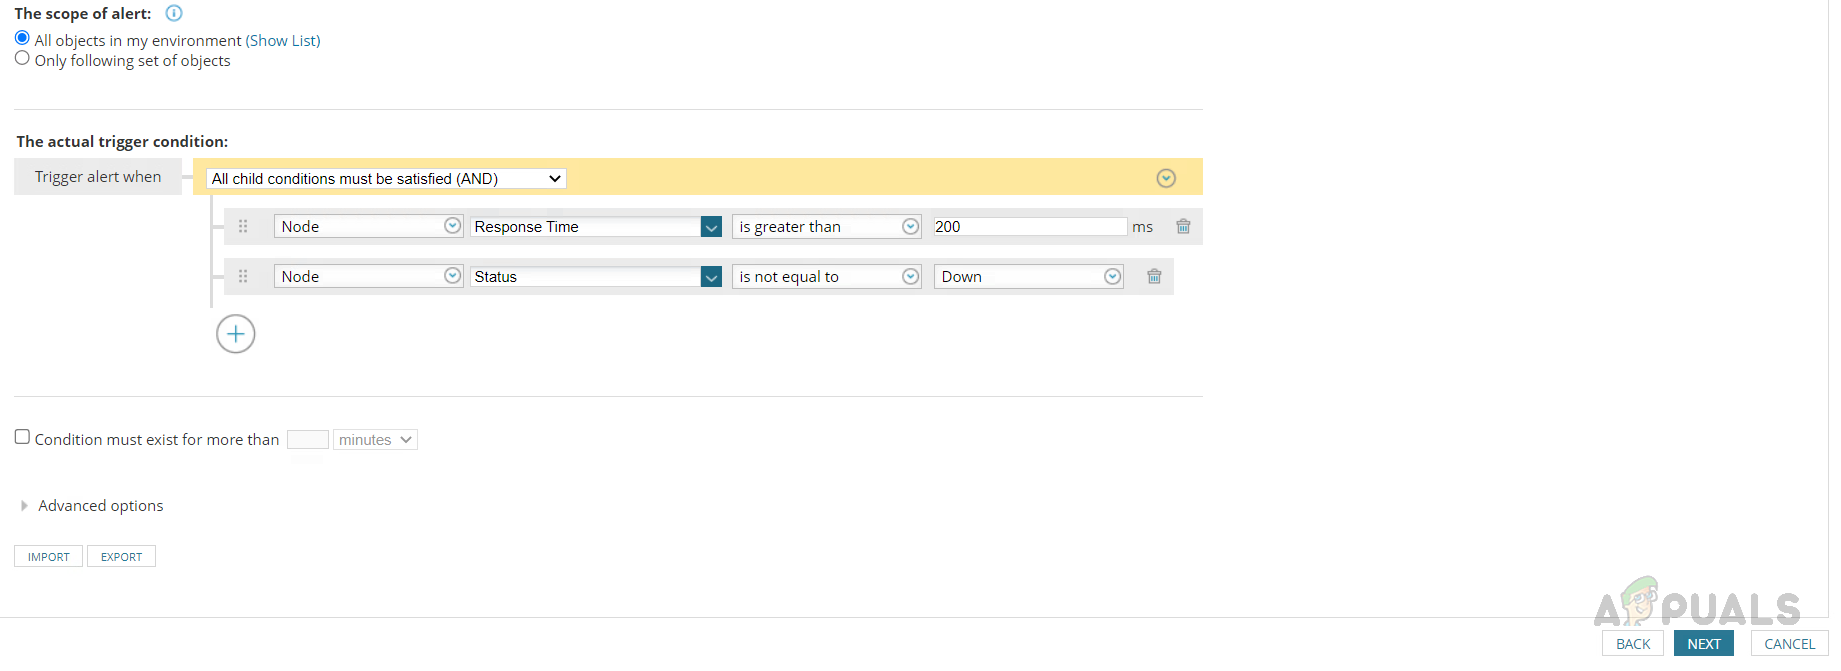
To learn how to choose the variables for the trigger condition refer to the article Using Solarwinds Advanced Alerts to Manage Network Issues. - Click on Next once the condition is set.
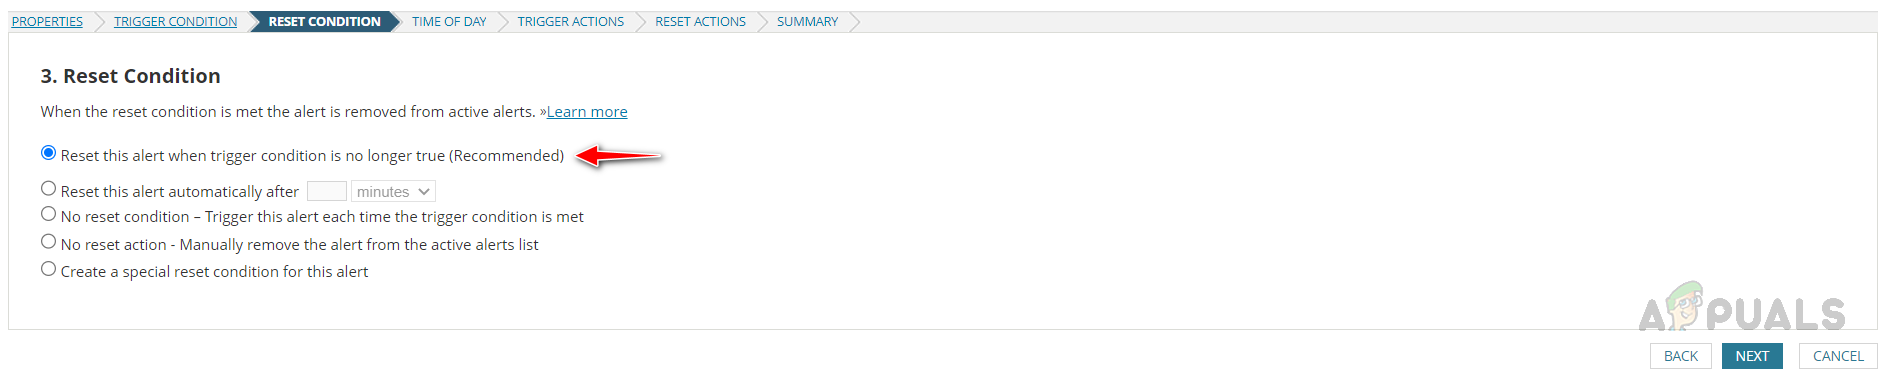
- You can use the default reset condition, click on Next once you set the reset condition.
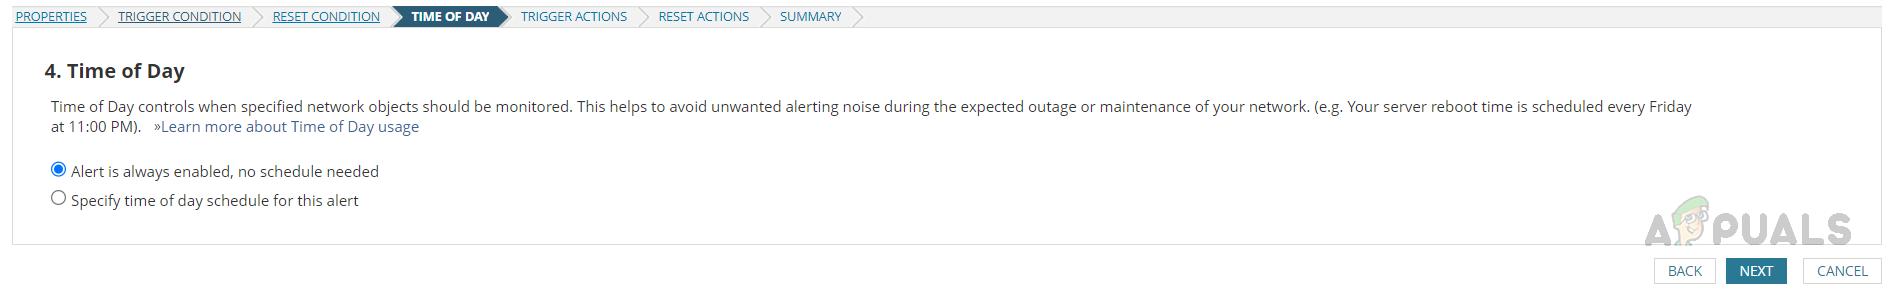
- Select the necessary option in the Time of Day section based on your need, if you would like to enable the alert always select the first option and if you would like to enable/disable it at certain time periods then select the second option and then select the time that you would like to schedule.
- Solarwinds has various trigger action options, here let’s see how to set up an Email notification action.
- In the Trigger Actions section, click on Add Action.

- Scroll down, select Send an Email/Page, and click Configure Action.

- Provide a name for the action, and enter the recipient’s Email ID. You can also add Cc and Bcc in the Email action if required.

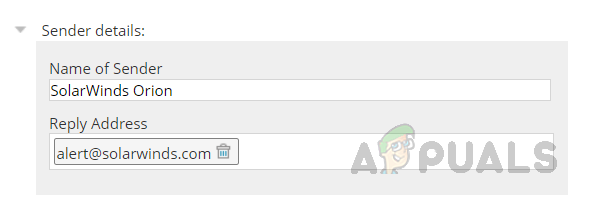
- Configure the sender details.
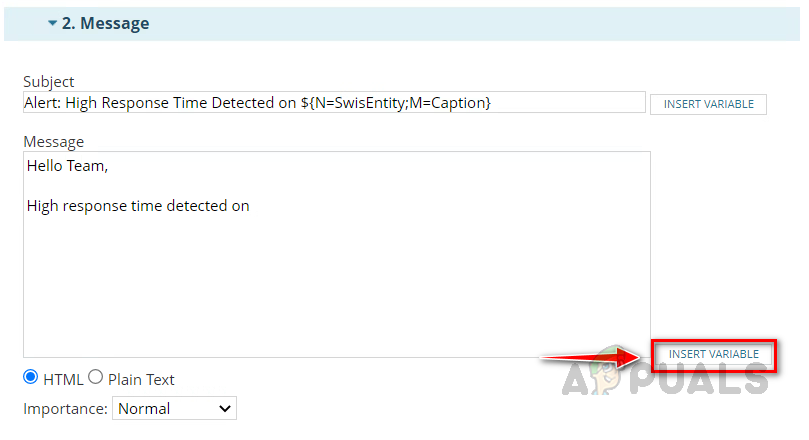
- Expand the Message section. We can see the default message configured by Solarwinds. We can use it or modify it.

- Let’s modify the default message. We can use the Insert Variable option to call the device and alert related fields like device name, IP address, alert name, alert triggered time, etc.
- Provide an appropriate subject for the Email. You can use the Insert Variable option to call the device-related information in the Email subject as well.
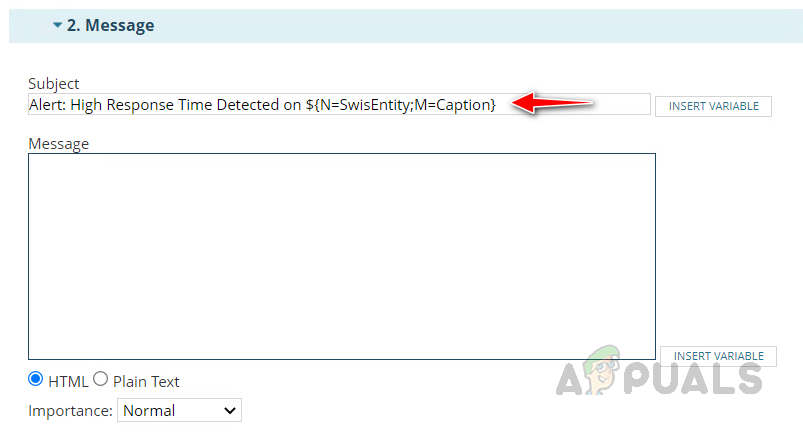
- Now, let’s modify the message body using the Insert Variable based on our needs.
- Enter a custom message in the message body based on your needs and then click on Insert Variable to bring the node related information.
- Search node name in the search box, select Node Name from the result and then click on Insert Variable.
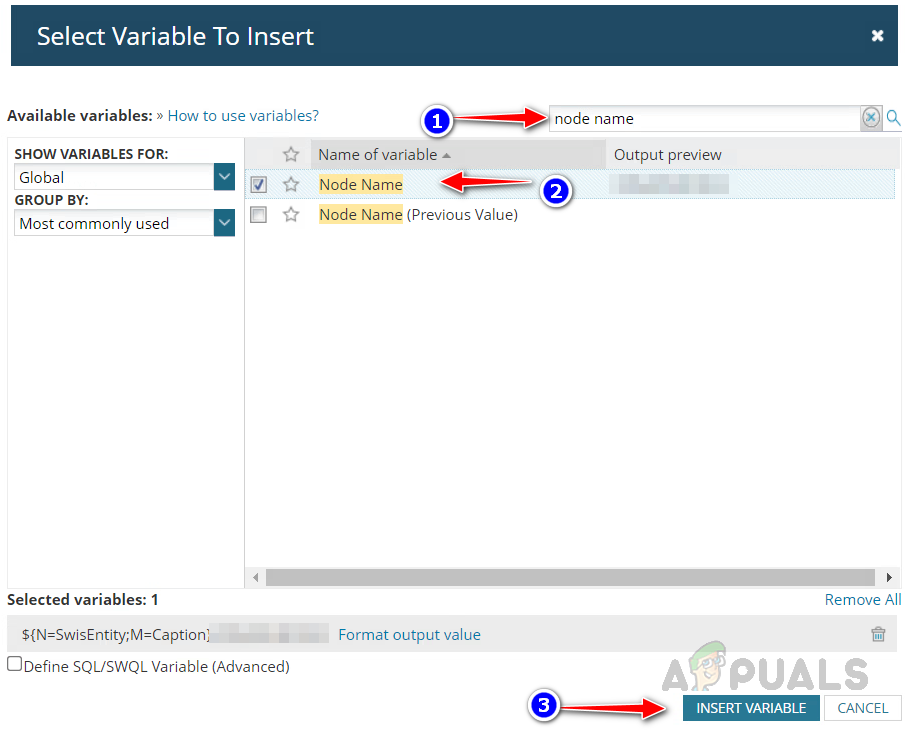
- Using the same method add all the necessary variables that you would like to add in the message body.
- Expand SMTP Server and select your SMTP server. If you configured your SMTP server already in Solarwinds, you could choose Default Server as your SMTP server.

- Expand the Time of Day. You can disable or enable the trigger action if required using this option.

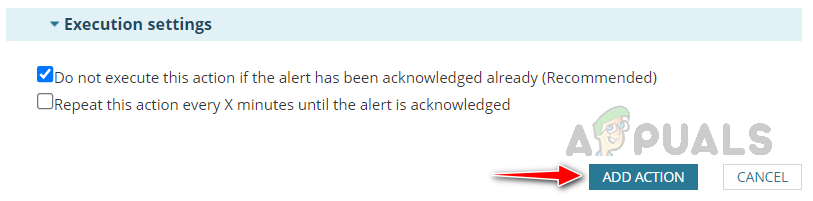
- Expand the Execution Settings and modify them if required. Once done, click on Add Action.
- Click on Next once the action has been added.
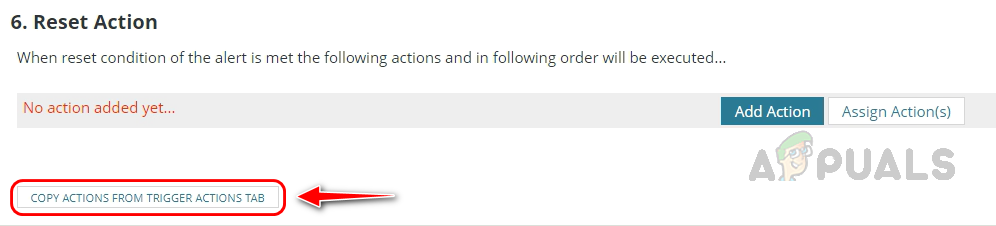
- You can copy the trigger action to reset the action section and make a few changes to configure the reset action. Click on Copy Actions from Trigger Action Tab and perform the necessary changes and click on Save.
- Once the action is configured, click on Next.
- On the Summary page, review the summary of the configured alert and then click on submit to save the alert.
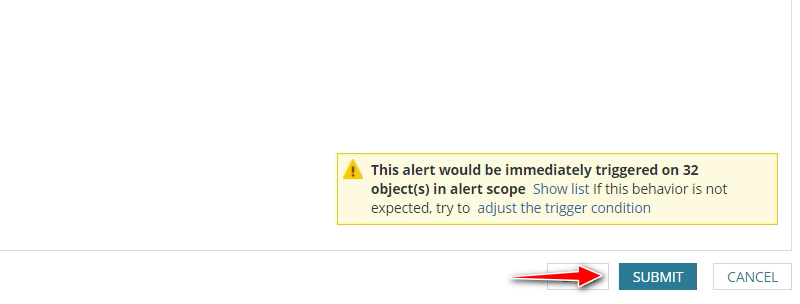 Before submitting the alert, you can see how many alerts will be triggered for the condition. With this, we can validate whether the alert condition is correct. If it is not, reconfigure the alert condition.
This is how we can configure an alert if the response time is high for any devices that are being monitored by SolarWinds.
Monitoring Network Latency Through Netpath Services
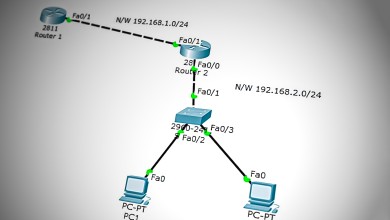
NetPath is one of the extraordinary features available in SolarWinds NPM. Netpath provides a visual representation of the Network paths, displaying all the hops between a source to a destination. Netpath continuously analyzes and discovers dynamic network paths. Netpath also collects performance data for all the devices in the path. This helps to identify if any issues are detected anywhere between a source and the destination.
To create a Netpath between any source and destination and learn more about Netpath refer to the article How to Download and Use Open Visual TraceRoute?
Now, let’s see how to check Network Latency and create an alert for latency issues detected in the Netpath.
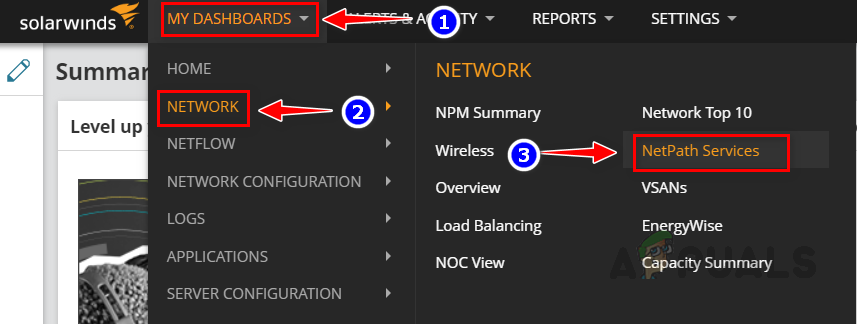
- Go to My Dashboards -> Network and then click on NetPath Services.
- Click on any of the created NetPath to open.
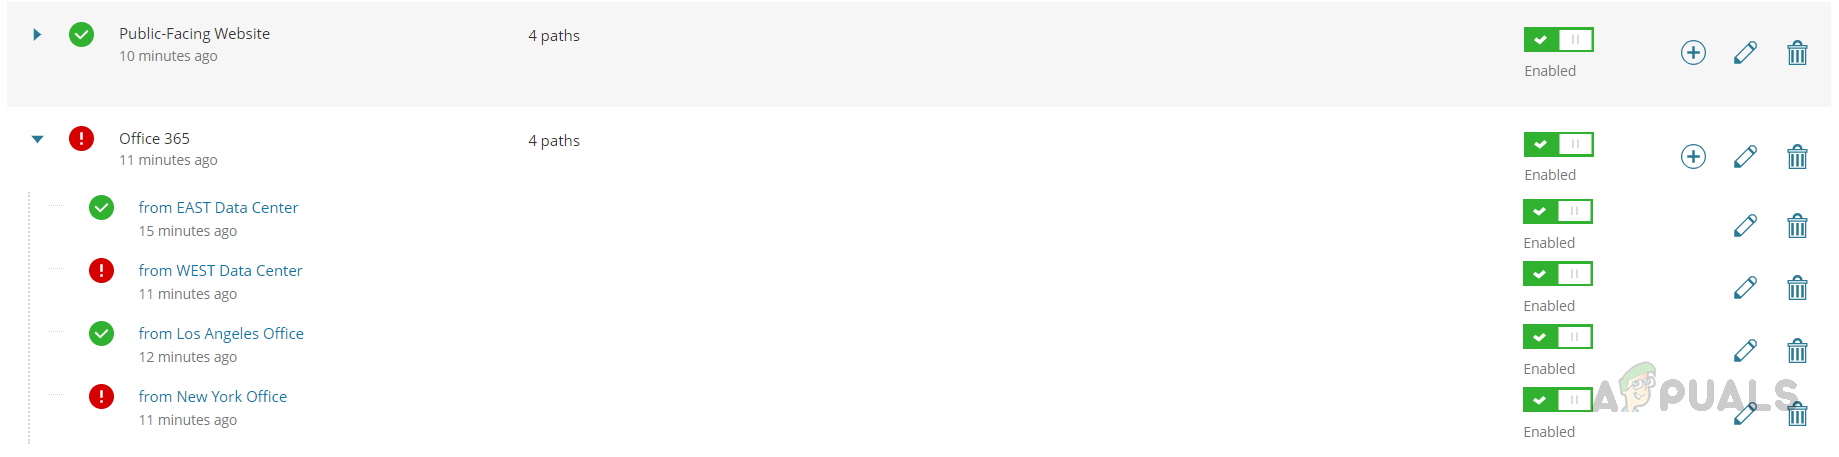
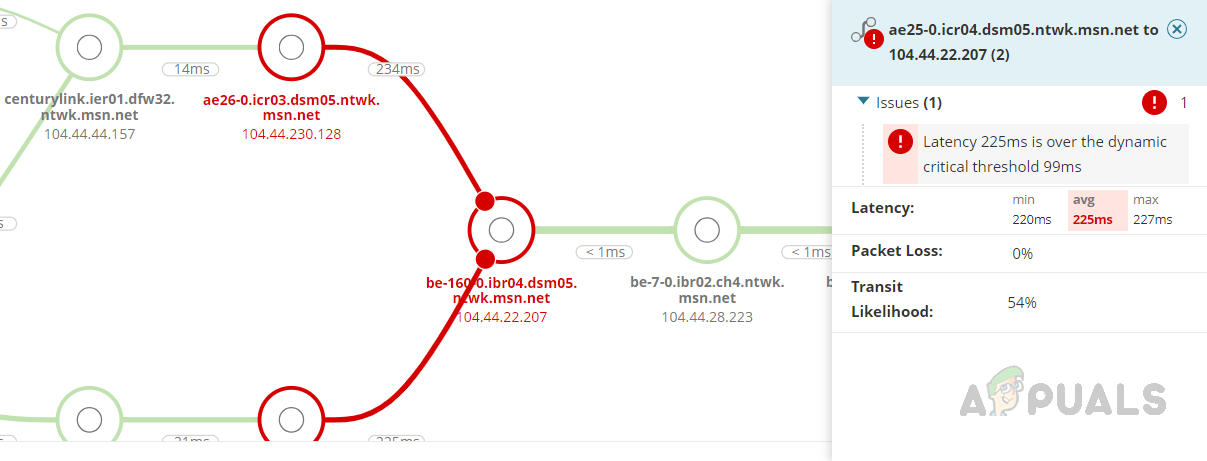
- You can see the response time of the path and if it is beyond the SolarWinds threshold then it will be marked as critical and visible in Red color.
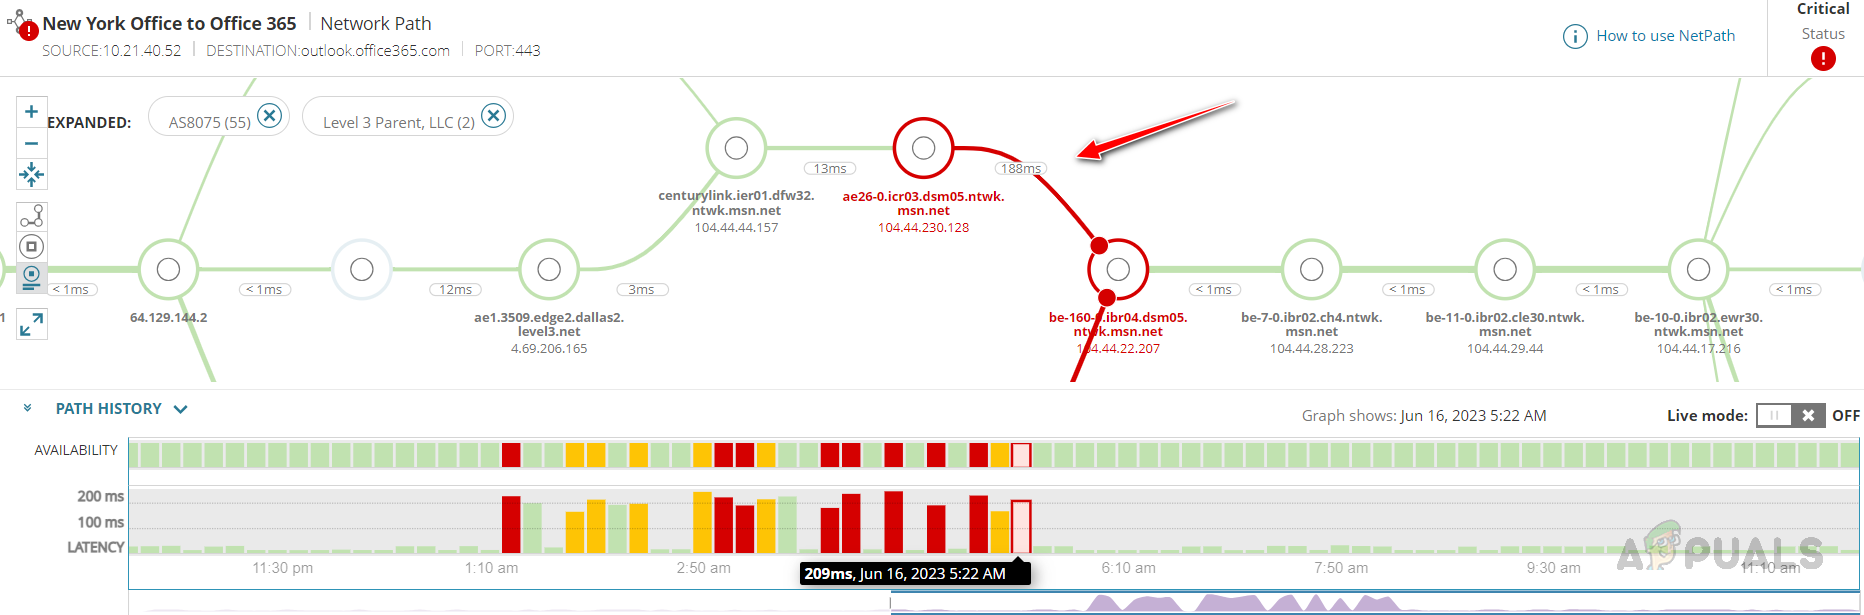
- You can click on the path to see more details about the path and the issue.
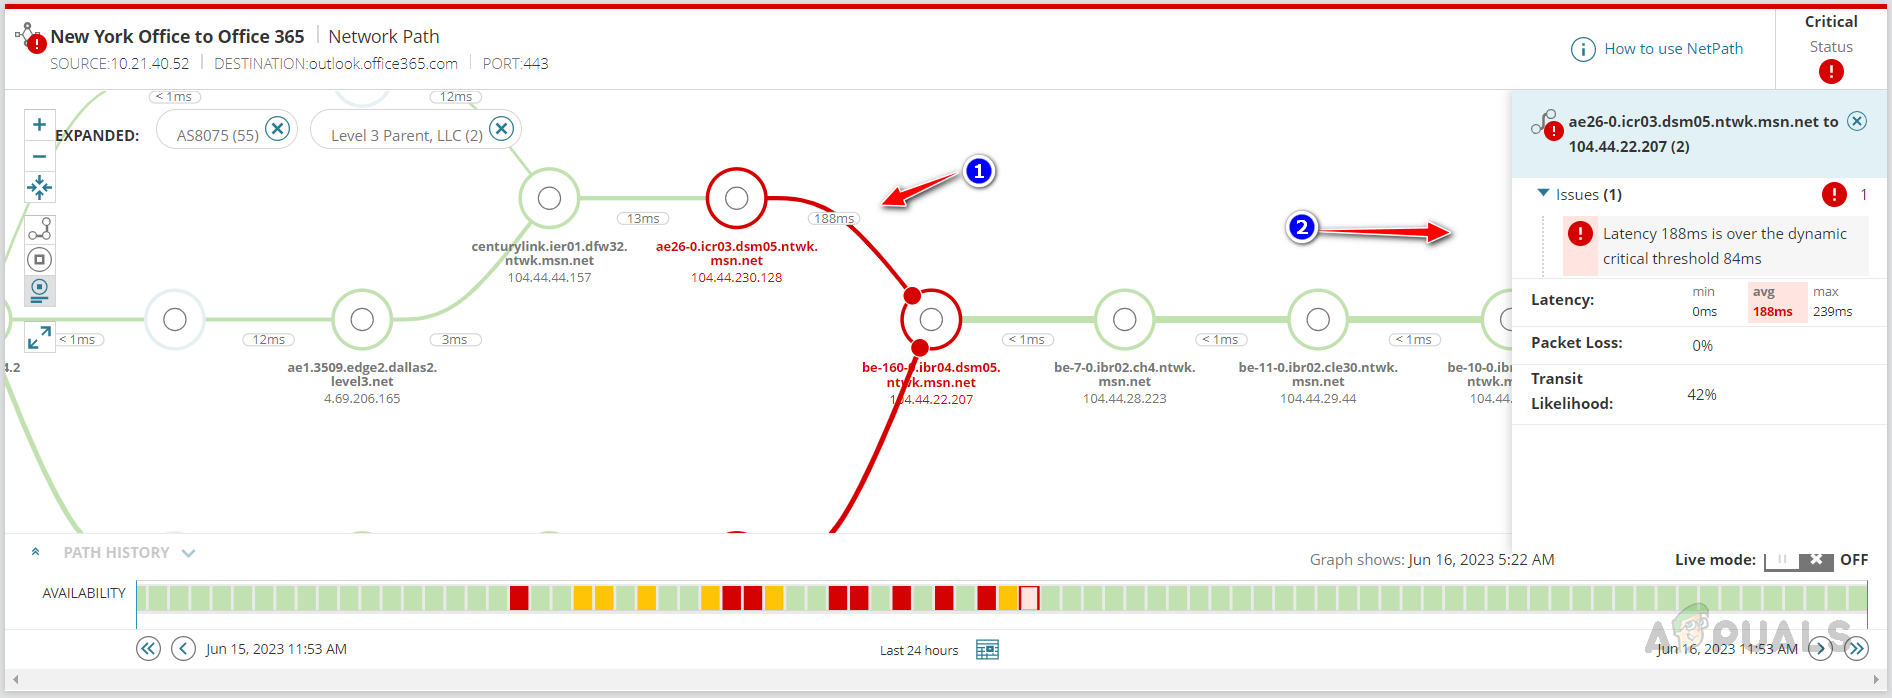
- By creating NetPath services for critical paths in the environment, network latency issues can be easily identified and fixed even before it causes any major outages.
Now, let’s see how to configure alerts for latency issues detected in NetPath.
Configuring Alert for NetPath Services
Follow the below steps to configure latency issues observed in NetPath services.
- Go to Settings and then All Settings.
- Click on Manage Alerts under Alerts & Reports.
- Click on Add New Alert.
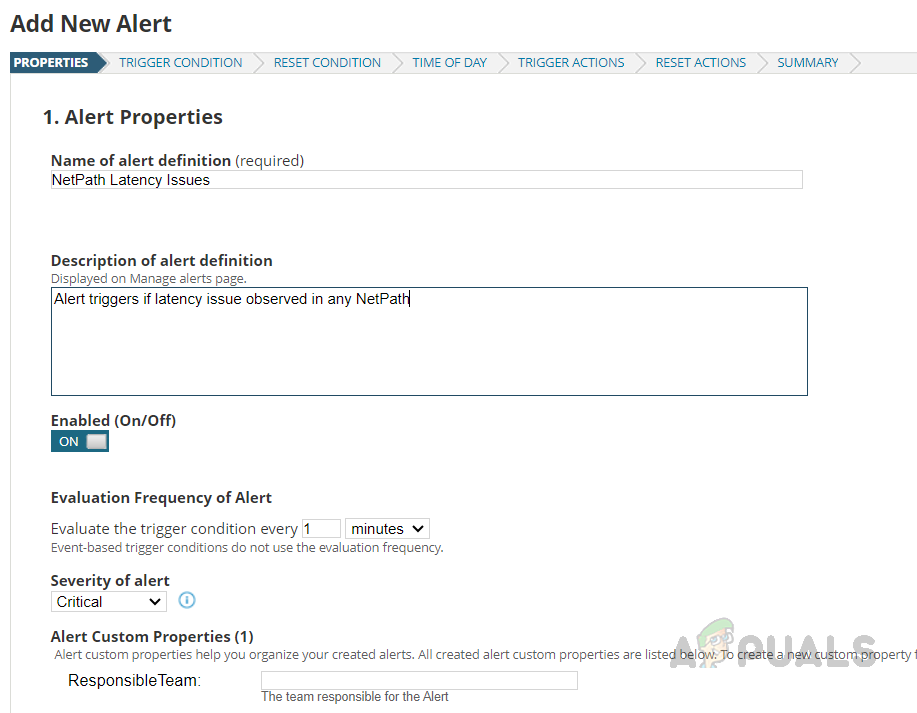
- Provide an appropriate name and description for the alert. Select the required evaluation frequency and severity for the alert.
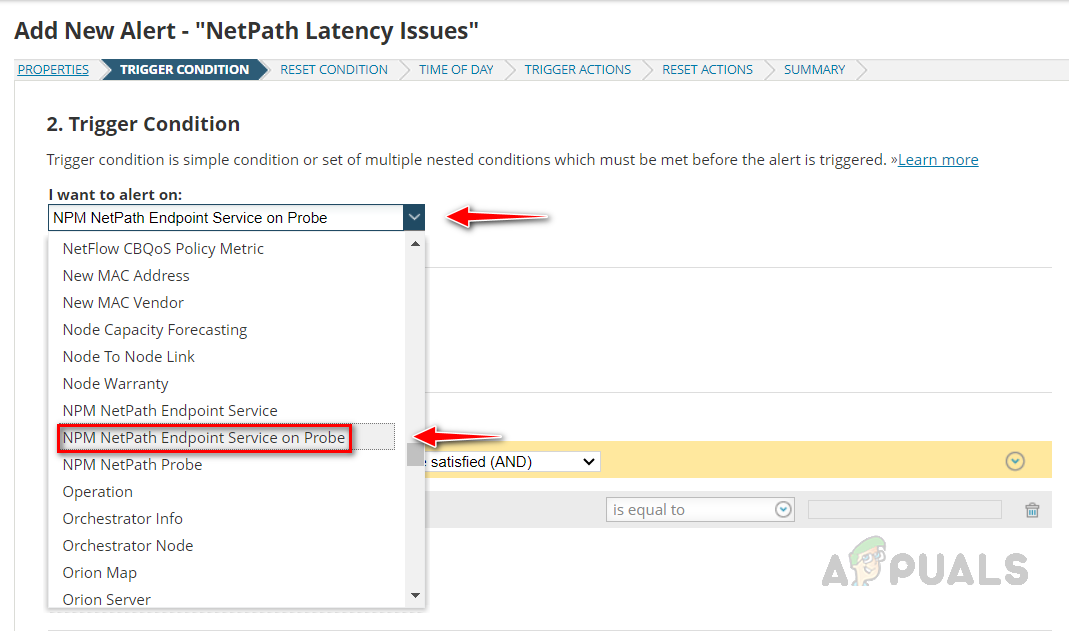
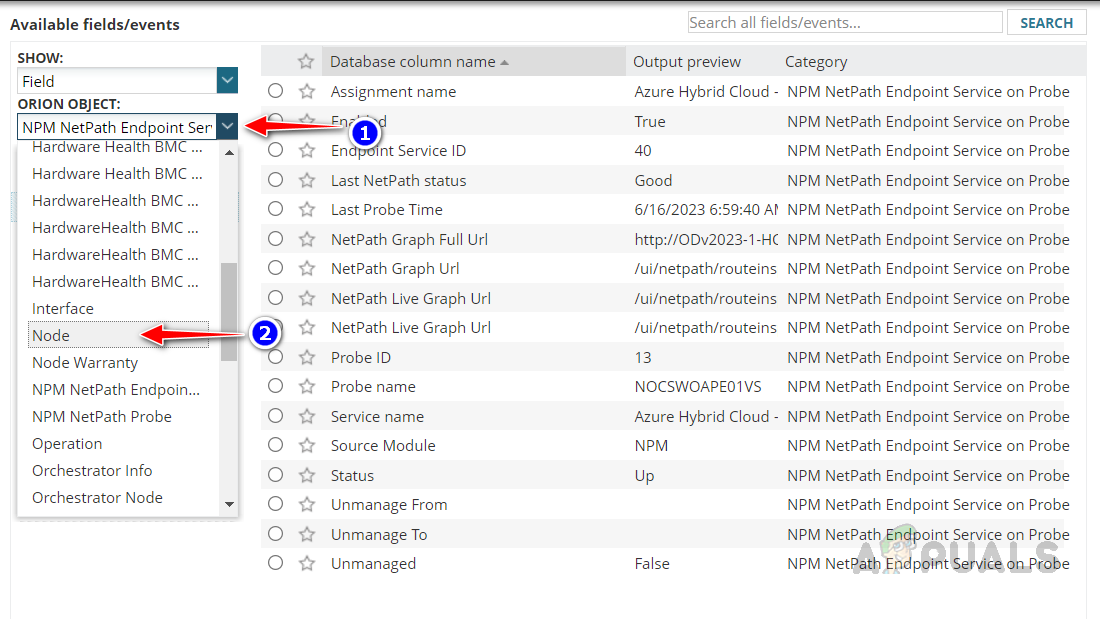
- Select NPM NetPath Endpoint Service on Probe from the I want to alert on drop-down list.
- Click on the drop-down list and select Browse all objects.
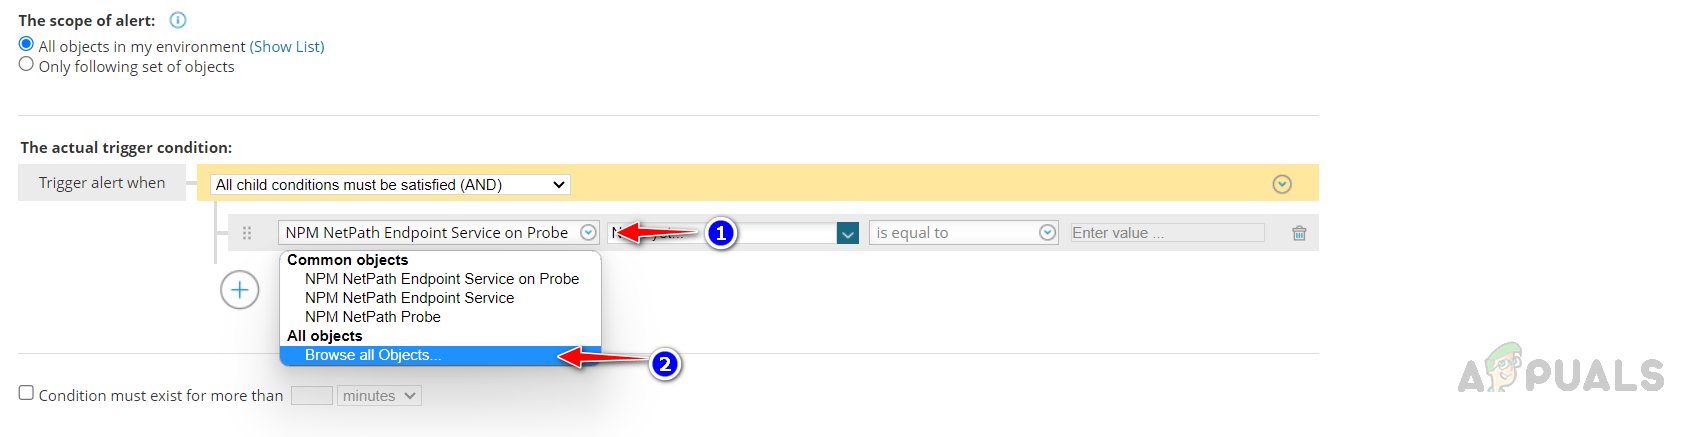
- Select Node from the Orion Object drop-down list.
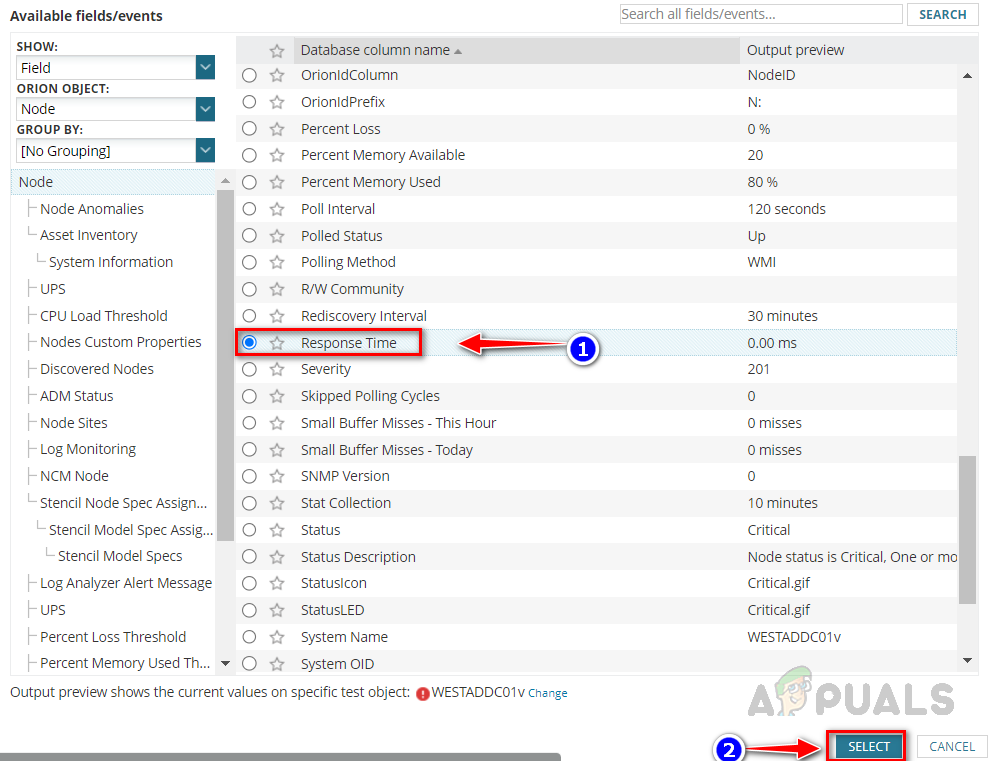
- Select Response Time from the Node’s table and then click on Select.
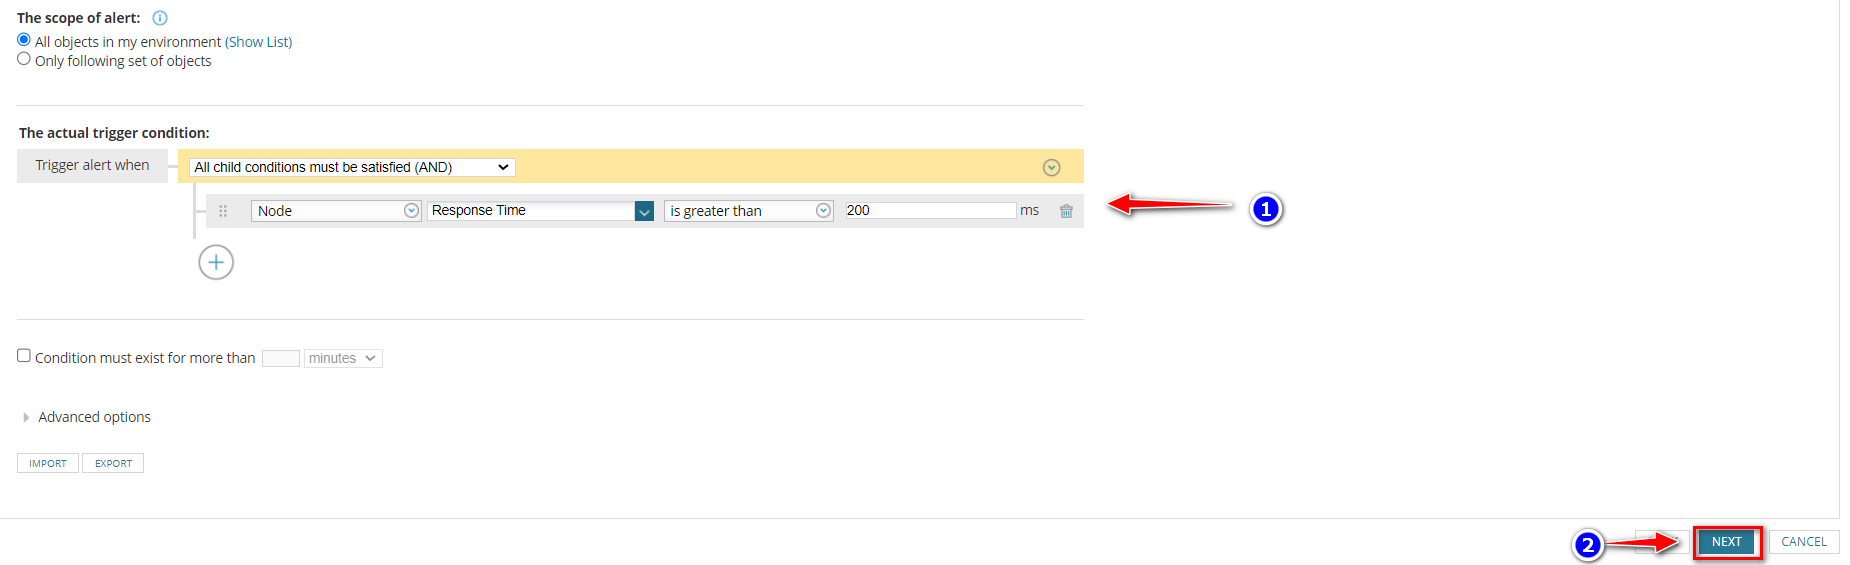
- Configure the trigger condition as shown below and then click on Next.
- Configure all other sections as we have shown earlier or read the article Using Solarwinds Advanced Alerts to Manage Network Issues to get a better understanding of how to configure alerts.
This is how we can use Solarwinds NetPath services to detect and alert if any latency issues are observed in the Network.
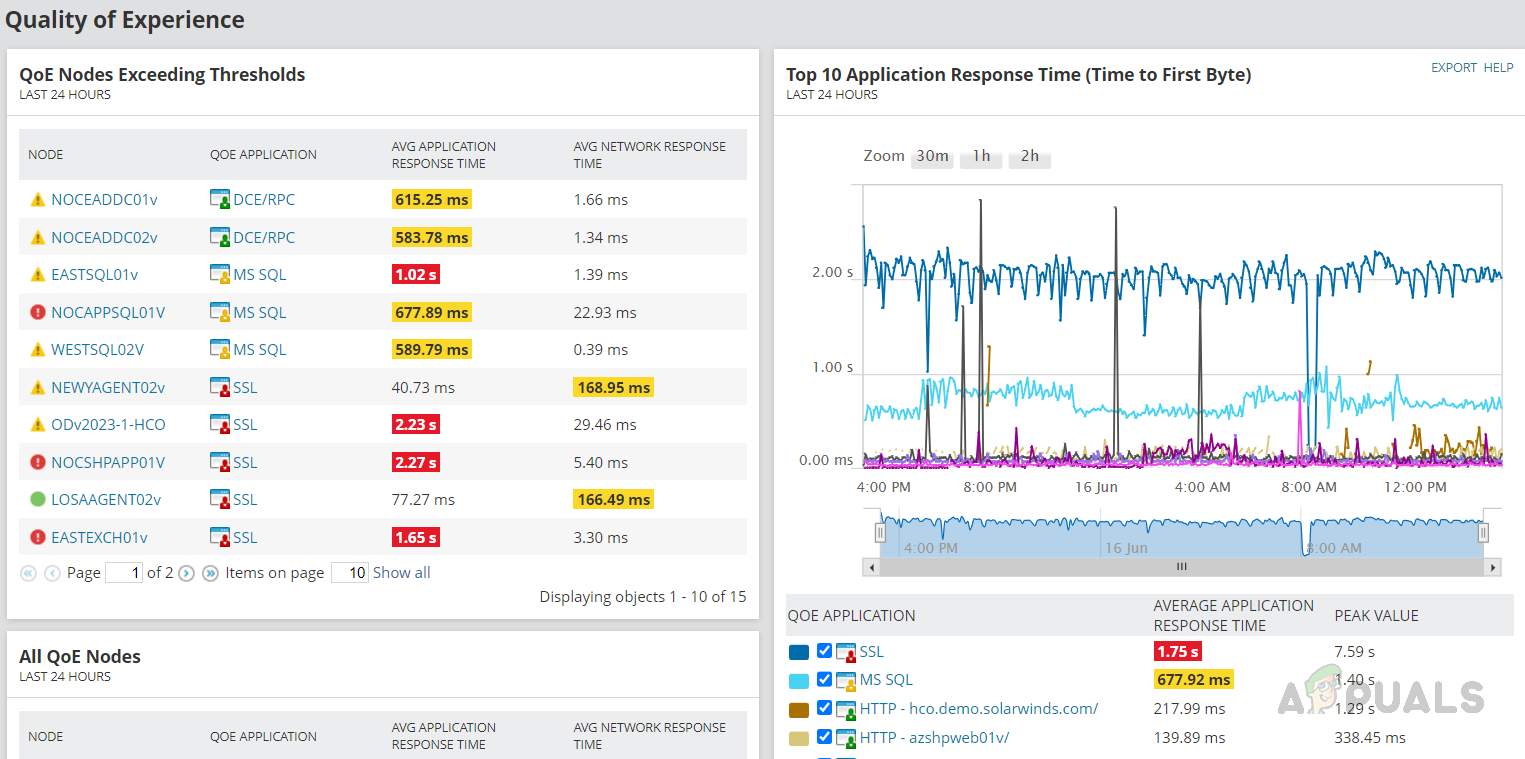
Solarwinds QoE (Quality of Experience)
SolarWinds offers yet another extraordinary feature called QoE (SolarWinds QoE) for performing deep packet analysis. By using SolarWinds QoE, Network Administrators can monitor latency issues more closely. SolarWinds QoE intelligently analyzes the traffic and determines whether the latency occurred at the Network layer or the Application layer. This reduces the effort needed to identify where the issue occurs, whether it’s in the Network or the Application. Respective administrators can immediately start troubleshooting issues to mitigate any major impact on the organization.
To learn how to configure and use the Solarwinds QoE refer to the article How to use Solarwinds QoE for Deep Packet Analysis?
Solarwinds also offers few other modules like NetFlow Traffic Analyzer (Solarwinds NTA) and VoIP & Network Quality Manager (Solarwinds VNQM), we can integrate these modules with Solarwinds NPM to leverage monitor options to get a better overview of the entire network.
In conclusion, Latency issues can have a significant impact on the environment, it is crucial to address Network Latency issues before it leads to any major impact on the environment. Using all these Solarwinds features makes a Network Administrators’ life easier to identify and troubleshoot the latency issues. By leveraging the capabilities of SolarWinds products, organizations can mitigate the impact of network latency and ensure optimal network performance.
Reviewed by Muhammad Zubyan