How to use Solarwinds QoE for Deep Packet Analysis?
Solarwinds offers a QoE feature to monitor the traffic and do deep packet analysis to monitor the overall quality of user experience. With this deep packet analysis, Network and System Administrators can determine whether it’s a network or application issue. These analyzed metrics can alert proactively before any potential problem occurs or the end users report any issues.
Benefits of Solarwinds QoE
- We can compare Network Response Time and Application Response Time to determine whether the issue is with the Network or the Application.
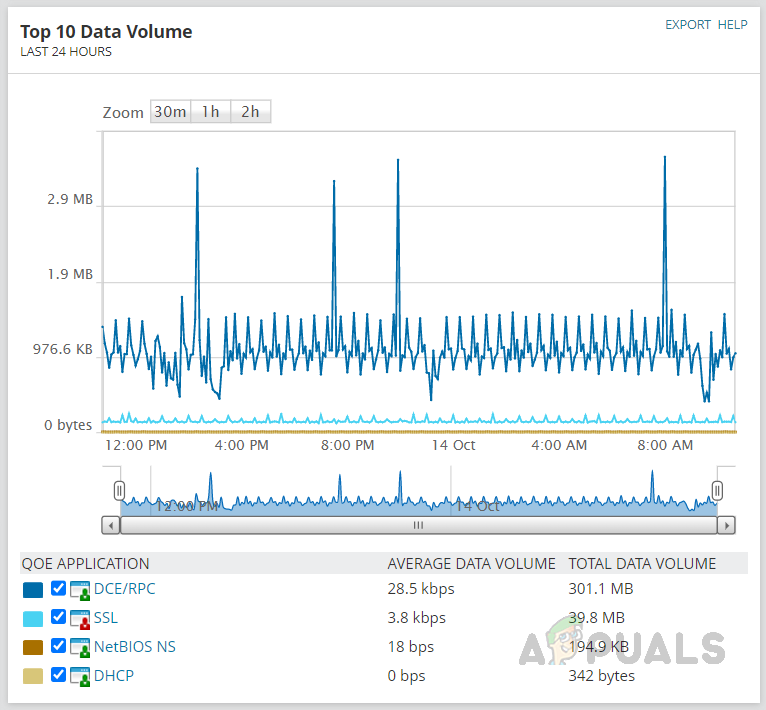
- Data Volume trends can be used to detect traffic anomalies and their cause.
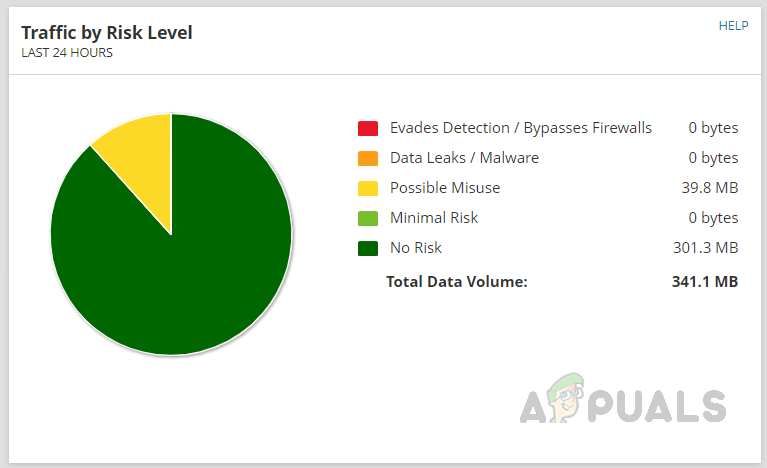
- We can monitor the risky types of traffic that might lead to data leaks.
How Solarwinds QoE Works?
Solarwinds QoE uses a packet analysis sensor to monitor the packet-level traffic information from network devices and application servers. There are two types of sensors used by Solarwinds QoE to monitor and analyze traffic.
- Packet Analysis Sensors for Networks (Network Sensor)
- Packet Analysis Sensors for Servers (Server Sensor)
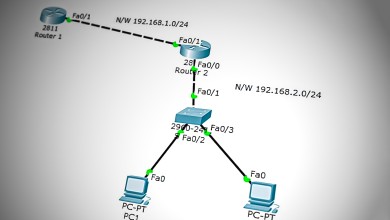
On the network end, a mirror or SPAN needs to be created on the core switch to which all the application servers are connected. The mirrored port should be connected to the server where the packet analysis sensor is installed. The sensor will collect all the traffic data through this port.
1. Packet Analysis Sensors for Networks (Network Sensor)
Network Sensor captures all traffic, analyzes the packets, and categorizes the packets by the application that flows through a device. Packets are analyzed for QoE metrics like network response time, traffic volume, etc., and then the details are sent to the Solarwinds server.
2. Packet Analysis Sensors for Servers (Server Sensor)
The server sensor captures all traffic sent to or from the application server. It analyzes them for QoE metrics like application response time, traffic volume, etc., and then the details are sent to the Solarwinds server.
Solarwinds QoE uses the information collected by Network Sensor and Application Sensor to detect performance issues and alert them before users identify the problem. These sensors can be deployed only on Windows-based systems. Let’s see how to deploy these sensors to capture the packets for deep analysis.
How to Deploy Packet Analysis Sensor
Deploying procedure is similar for both Network and Server sensors. The below steps can be used to deploy the sensors.
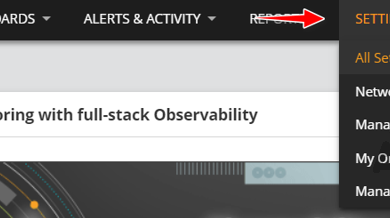
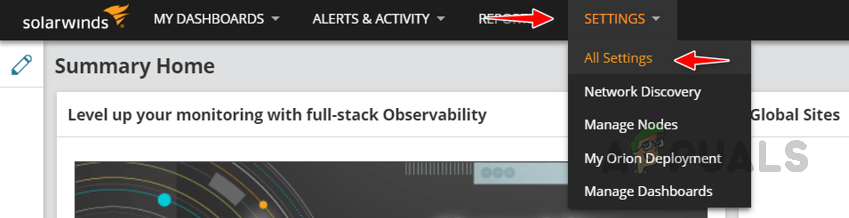
- In your Solarwinds web console, go to Settings and click on All Settings.
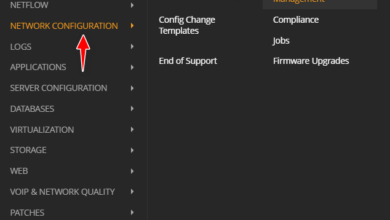
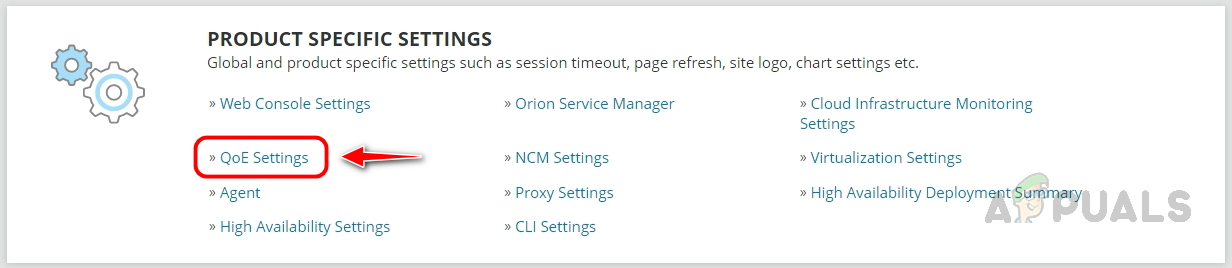
- Click on QoE Settings under Product Specific Settings.
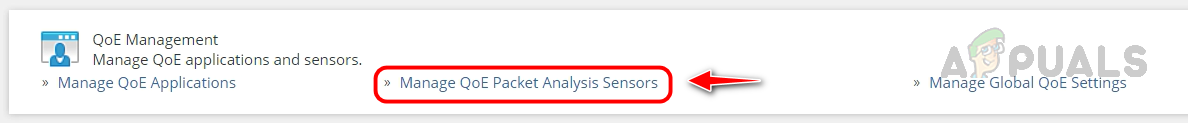
- Click on Manage QoE Packet Analysis Sensors.
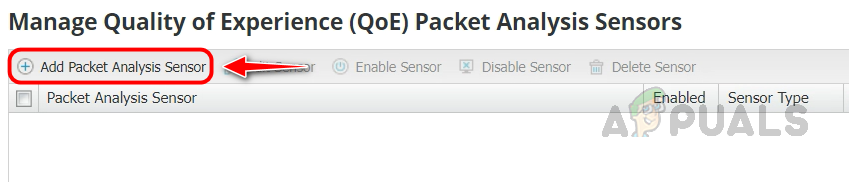
- Click on Add Packet Analysis Sensor.
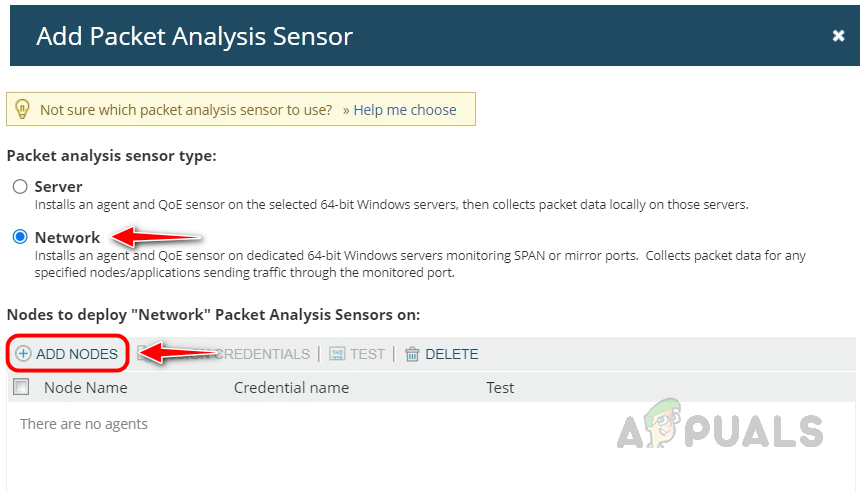
- Select the sensor type you want to deploy. Let’s select Network and click on Add Nodes for this demo.
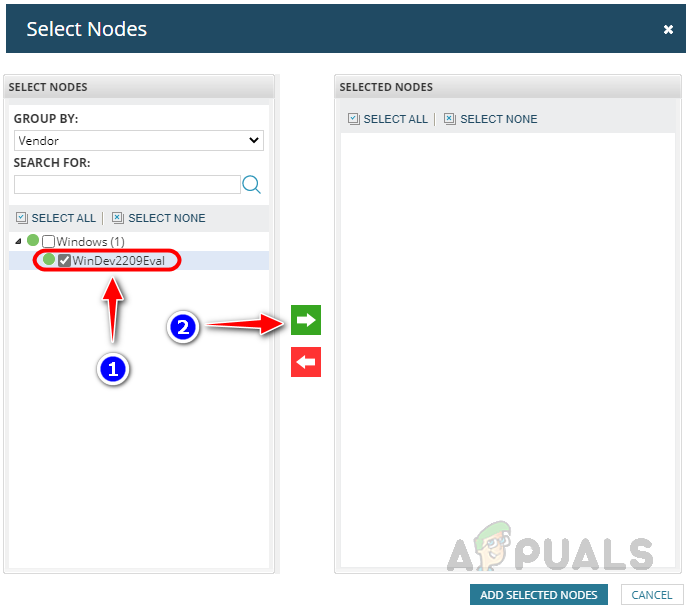
- Select the node you want to deploy the sensor to, and click on the green arrow to move the node to the selected nodes.
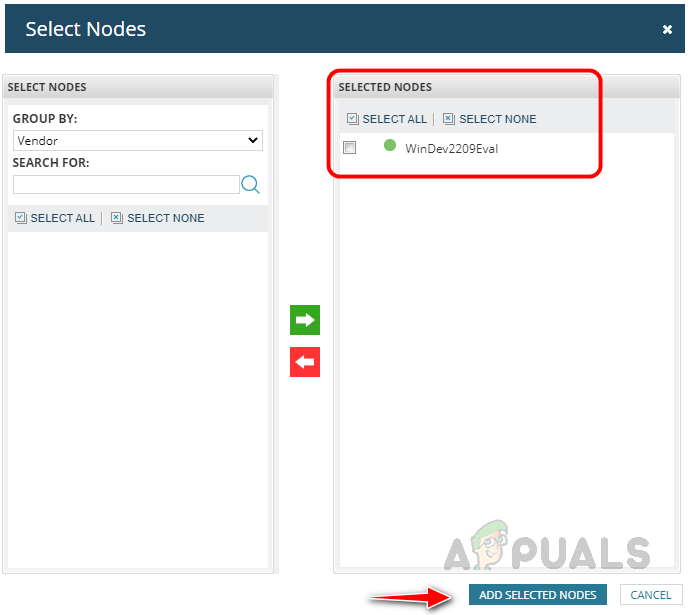
- Once the node is moved to selected nodes, click on Add Selected Nodes.
- Now, select the node and click on Test to validate whether the credentials used to monitor the node has enough privilege to deploy the sensor. We cannot deploy the sensor if the credentials don’t have enough privileges. Use a credential with enough privilege to deploy the sensor.
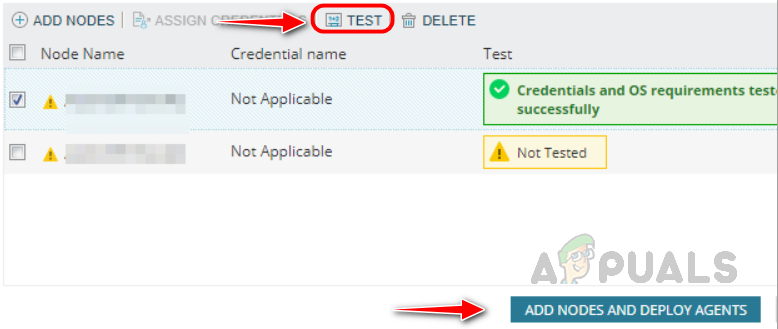
- Once successfully validated, click Add Nodes and Deploy Agents to deploy the sensor.
Once the packet analysis sensor is deployed on the server and the mirrored port is connected with the sensor server, nodes and applications are automatically monitored by Solarwinds QoE. We can control the sensor server’s behavior by customizing the global QoE settings.
Configuring Global QoE Settings
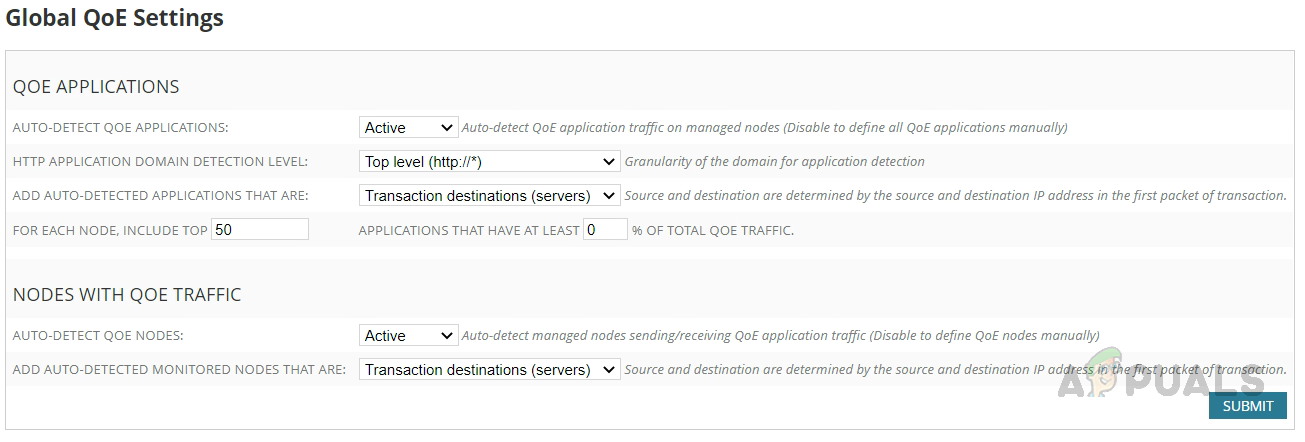
- On the QoE Settings page, click on Manage Global QoE Settings.

- You can customize the below settings based on your needs. You can use the default settings as well. Default settings have all the necessary configurations for monitoring.
Now we are good to monitor the traffic. Let’s see how to access the QoE dashboard to check the Network and Application traffic.
QoE Dashboard
We can use the QoE dashboard to check the analyzed Network and Application data. Follow the below steps for how to check the QoE Dashboard.
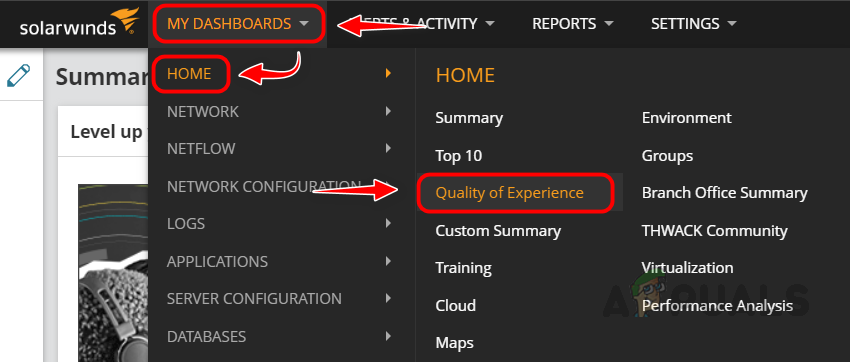
- Please hover your mouse over My Dashboards and click on Home. Click on Quality of Experience in the Home sub-menu.
- We can see the QoE Dashboard now, and we can see various widgets available in the dashboard. We can use those dashboards to check in case of any anomalies.
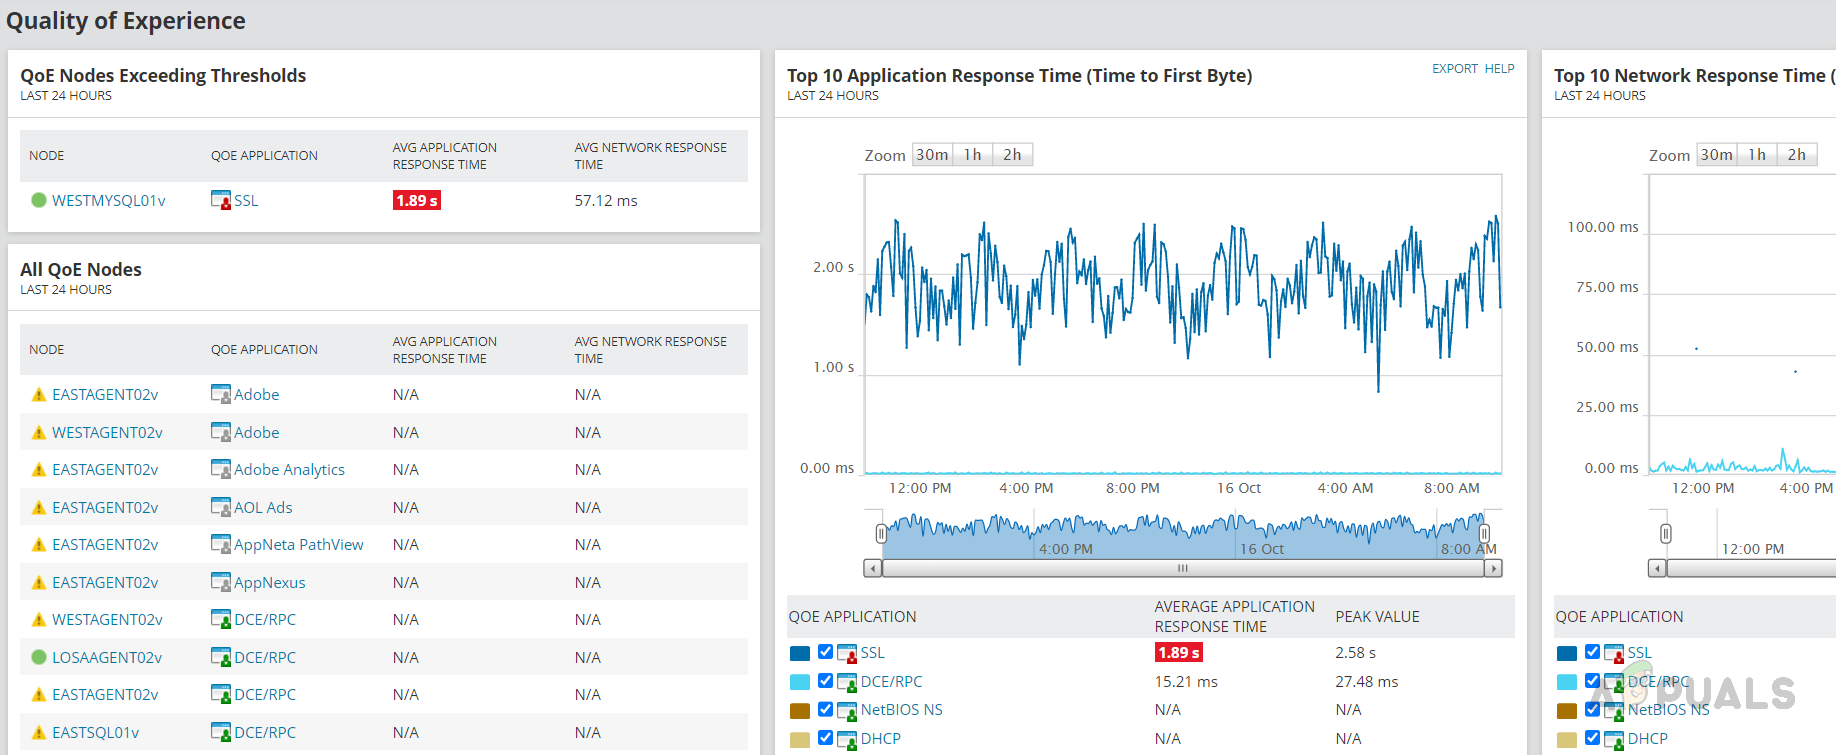
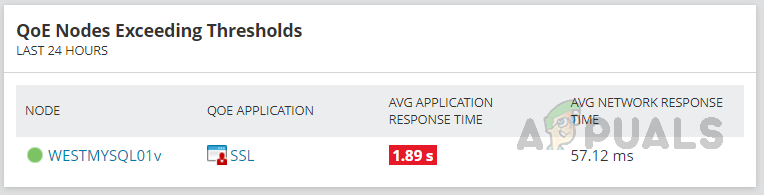
- If any anomalies are identified in the Network or Server response time, the respective application server and the application which breached the thresholds will appear in this dashboard.
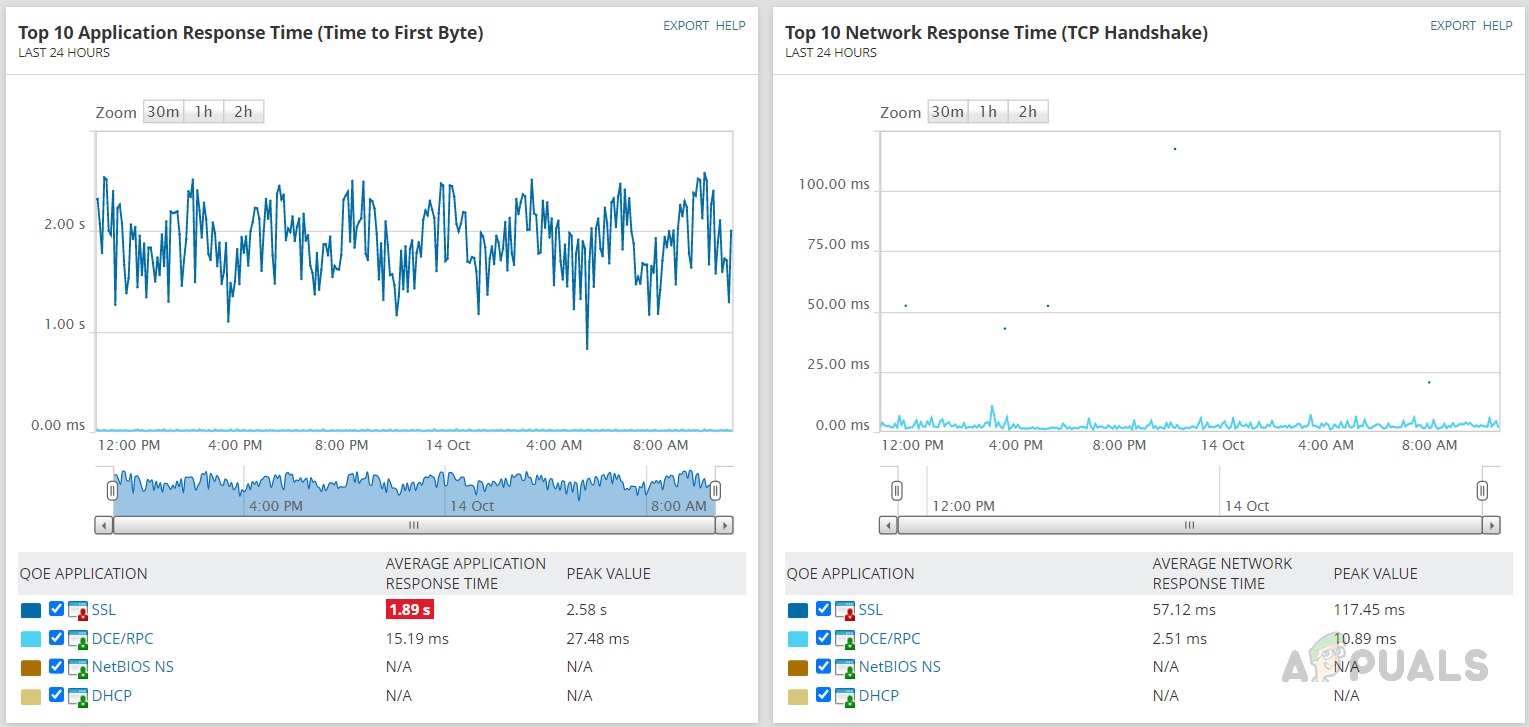
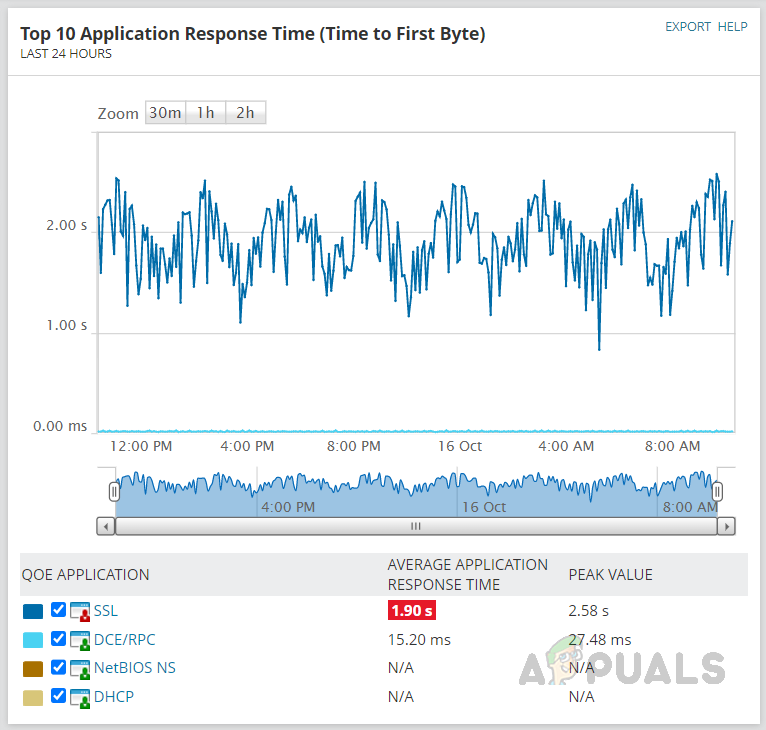
- In the Top 10 Application Response Time, we can see the top 10 applications taking time to respond to requests.
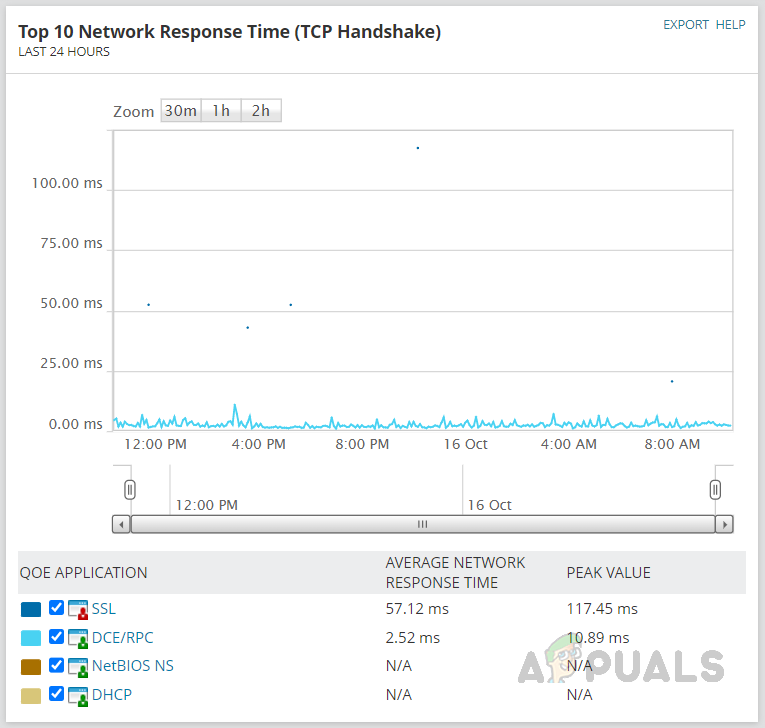
- In the Top 10 Network Response Time widget, we can see how much time the application takes to respond to a TCP handshake.
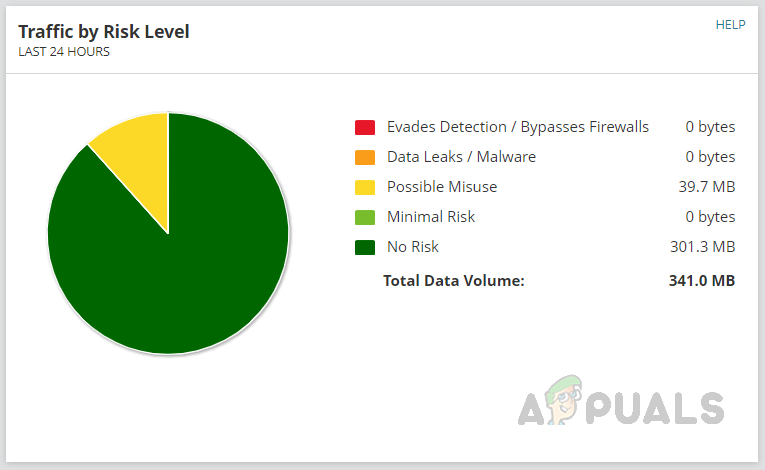
- We can use the Traffic by Risk Level widget to identify the risky traffic bypassing the firewall, leaking any data, etc.
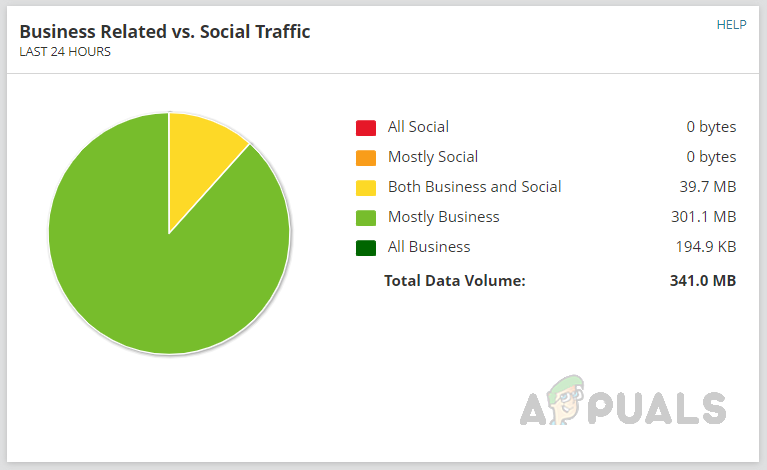
- There is a widget available to identify Business and Social Media traffic. With this, we candeterminey if any unwanted social media traffic is flowing on the Network. We can ask the user to terminate the session to avoid high bandwidth utilization.
We can use the QoE Dashboard to review the analyzed data and check if any anomalies are found in the Network or Application traffic.
Solarwinds also provides alerts for QoE. We can use the default alerts or use the default alert as a template to create a customized alert suitable for the environment.
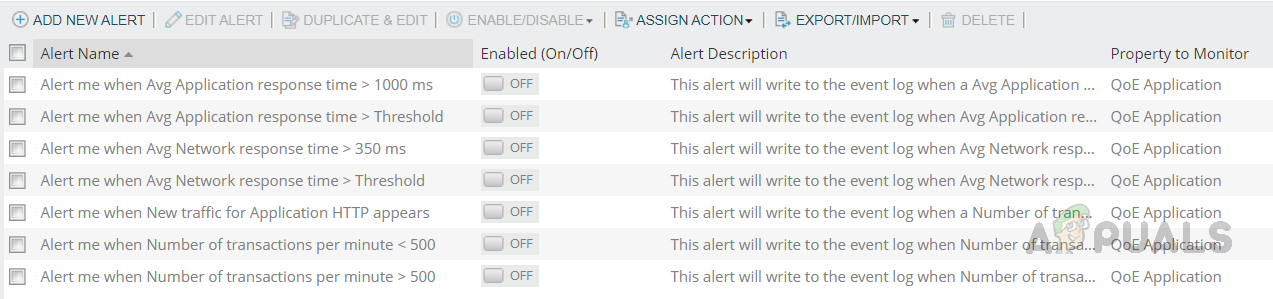
By setting the alerts, we can avoid checking the dashboards periodically. Alerts will trigger based on the thresholds we set, and we can use the dashboard to get more details for the triggered alert.
This is how we can use Solarwinds QoE to analyze the traffic in our Network to detect any anomalies affecting the end-user experience and fix them even before the end users report them.