How to Download and Use Open Visual TraceRoute?
When it comes to networks, ensuring optimal performance is one of the most important tasks of a network administrator. In today’s world where everything is digital, connection problems have become even more generic. To help with this, keeping a track of your whole network definitely helps especially when you have mapped your network devices. Mapping is a really useful functionality that can help you in making sure that your network is online at all times. With the help of a map, you can know when and where a device disconnects so that it can be addressed quickly. However, while mapping does help, in this digital world, it certainly is not enough to keep track of your entire network.
Every network administrator has to optimize their network and monitor the network devices present. If you wish to keep track of your network thoroughly, netpath is definitely a feature that you should be looking forward to implementing in your network. Packed inside the infamous Network Performance Monitor, a tool developed by SolarWinds which gives you the ability to monitor your network performance thoroughly, NetPath is a basically a graphical version of your typical traceroute. Traceroute is a really neat tool that allows you to see how the packets in your network are being transmitted from the host machine to the target.
NetPath and Visual TraceRoute
First things first, let us discuss the working of traceroute before getting into further details. Basically, traceroute works on the mechanism of TTL or Time to live. The working procedure is rather simple. When you are communicating with a device on a network, you are essentially sending packets that are being received by the target. During this, the packet can hop around different devices before finally reaching the target. Traceroute assigns a TTL value to each packet as it leaves and the value is decremented each time it reaches a router which directs it to a different router and in the end, the packet reaches the target machine. When a packet reaches a certain router, the TTL value is decremented and the device sends back a ping to the host. This ping is used by traceroute to find the identity of the device. This helps you in visualizing your network.
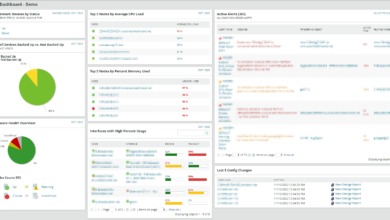
Now, traceroute is a command-line tool so there are no visuals and you have plain text to work with. However, that changes with NetPath. With the help of NetPath, you are able to visualize this said traceroute and instead of plain data, you can actually see a graph of the network which is way more convenient than your generic methods. This is how NetPath gains an upper hand on your normal traceroute techniques and every network admin should opt for it.
Installing Network Performance Monitor
As we have mentioned, NetPath is one feature from the long list of features that come with the Network Performance Monitor by SolarWinds. The SolarWinds name is no stranger to network admins and they have gained a huge reputation for themselves due to the high quality products. NPM is no exception here and we do have a comprehensive NPM review that will explain your whys.
In order to be able to use NetPath, you will first have to install NPM. To do this, go ahead and download the tool from this link. Once you have downloaded the tool, you will find yourself with the Orion installer. Follow the instructions given down below to install NPM:
- First of all, run the downloaded Orion Installer on your system.
- On the Welcome screen, you can choose the type of installation you wish to go through. Lightweight installs the required components of NPM on your system locally, which is often good for evaluating the product. You can choose the Standard Installation if you have an SQL Server already set up. Then, click Next.
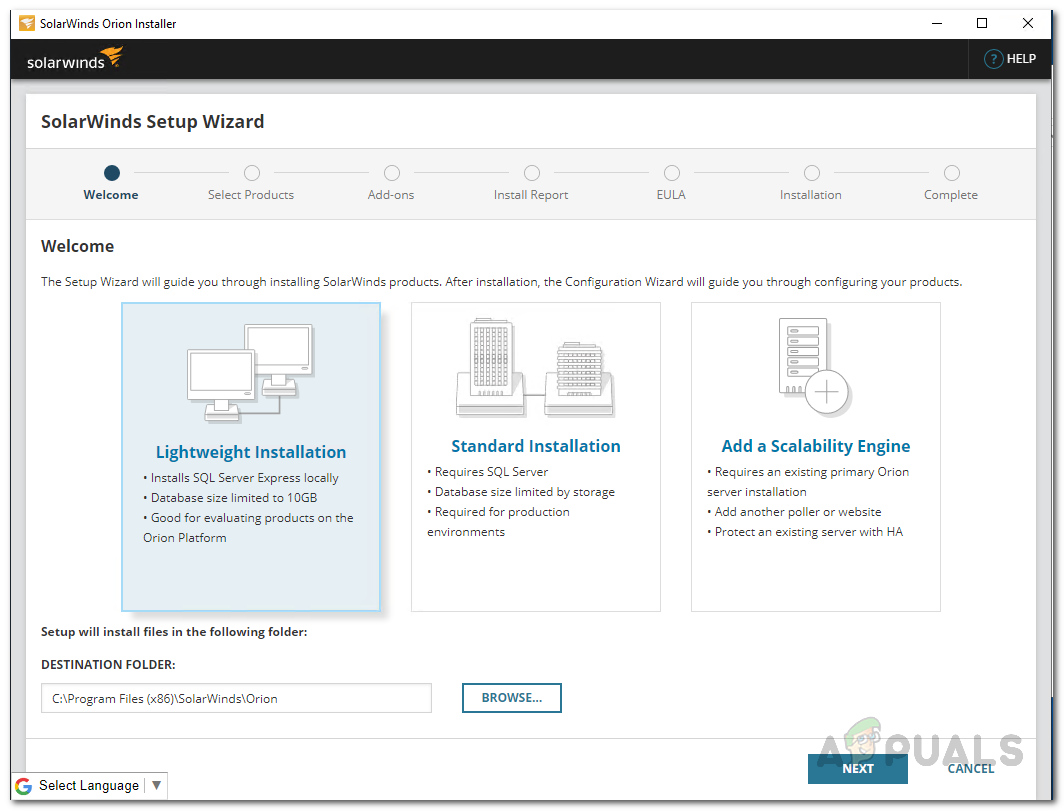
Choosing Installation Type - Next up, on the Select Products tab, make sure that Network Performance Monitor is selected from the list and then click the Next button.
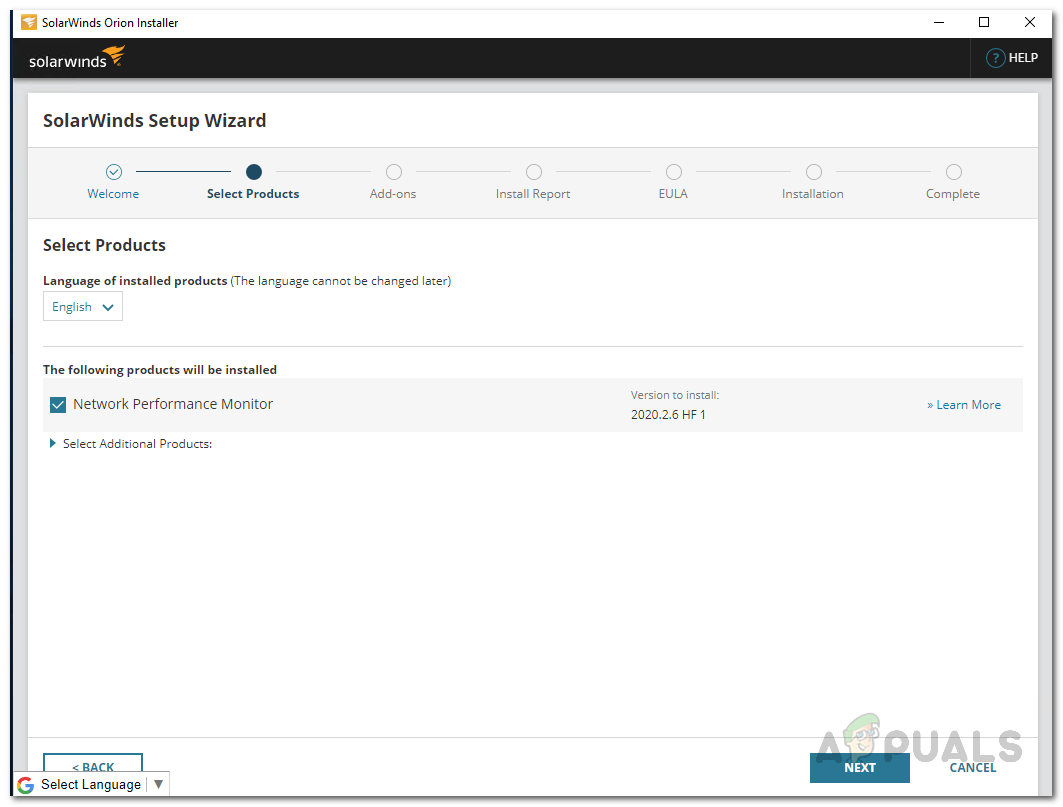
Selecting NPM Product to Install - After that, the installer will perform a system check so wait for it to complete. Then, agree to the license agreement on the next page and click Next.
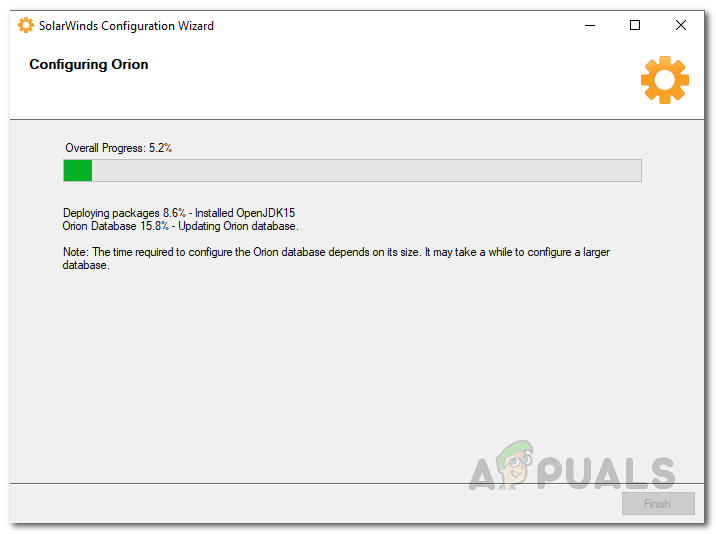
- At this point, the installer will begin installing Network Performance Monitor on your system. Wait for it to complete.
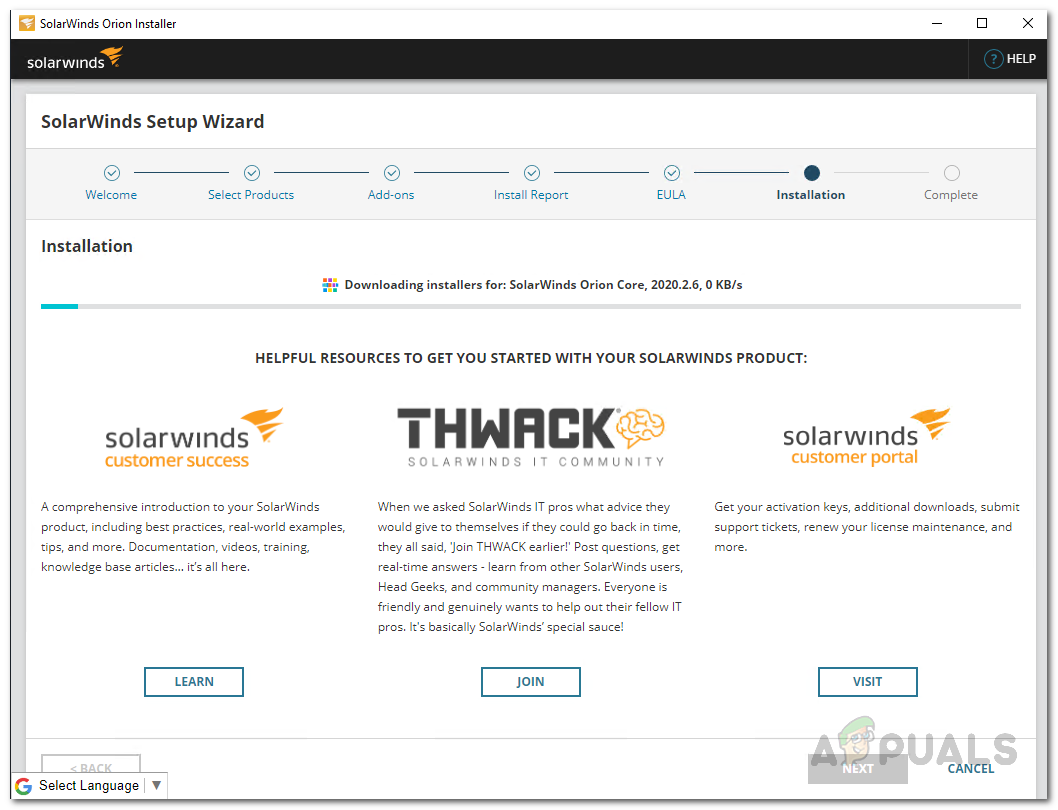
Orion Installing the Components - Once the installation is complete, you will be taken to the initial Configuration Wizard.
- Click the Next button on the Configuration Wizard to start. If you went with Lightweight Installation, the Configuration Wizard will configure everything on its own so you can skip the instructions below.
Orion Configuration Wizard - First off, on the Service Settings page, check that the services are ticked and then click the Next button.
- If you went with Standard Installation, you will be asked to enter your database credentials at this point. Provide the required information and then click Next.
- Then, on the Database Account page, either provide the account credentials that the Orion Web Console will use to access the database or create a new account.
- After that, click the Next button and wait for the configuration wizard to complete. Once done, click the Finish button.
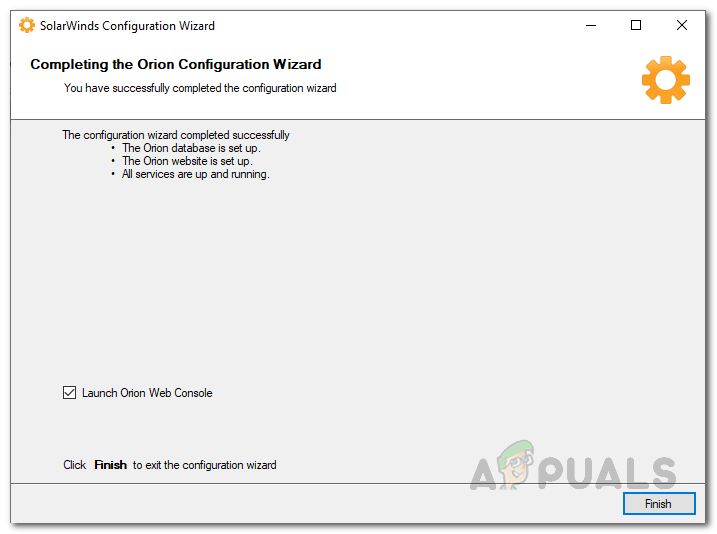
Completed Configuration
Create NetPath Service
To start using NetPath and take advantage of a visual traceroute, we will first have to create a service. A service is basically the destination device to which you want a map. We recommend deploying these services for the applications that are really important. NetPath services are essentially monitored by probes. To create a service, follow the instructions given down below:
- When you close the Configuration Wizard, you will be taken to the Orion Web Console automatically. In case you are not, you can access the web console by entering “hostnameorIPaddress:8787” in the address bar. Here, 8787 is the default port used by the Orion web console.
- If this is the first time you open up the web console, you will be prompted to create a password for the admin account. Otherwise, login to your web console.
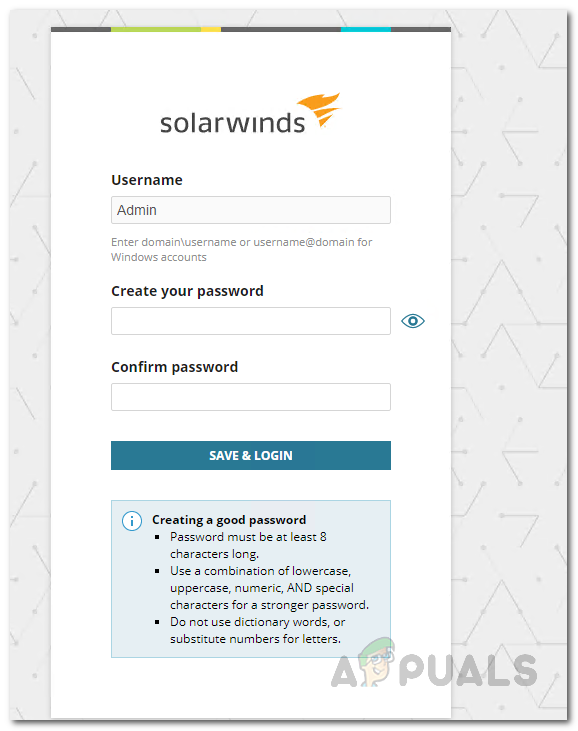
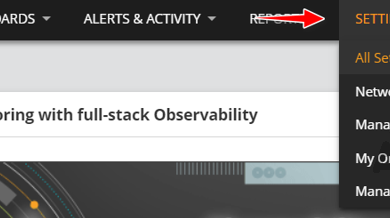
Setting Password for the Admin Account - Once you are logged in, navigate to My Dashboard and from the drop-down menu, choose the NetPath Services option under Network.
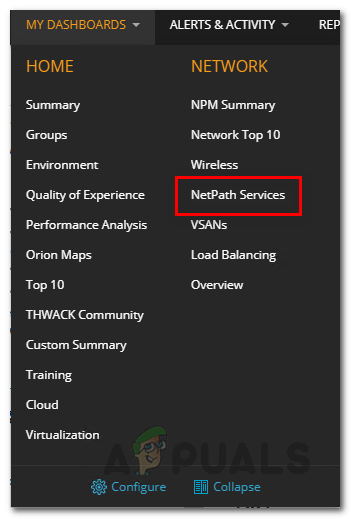
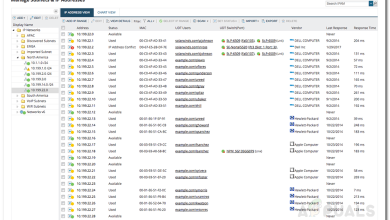
Navigating to NetPath Services - On the NetPath Services page, click on the Create New Service button to create a service.
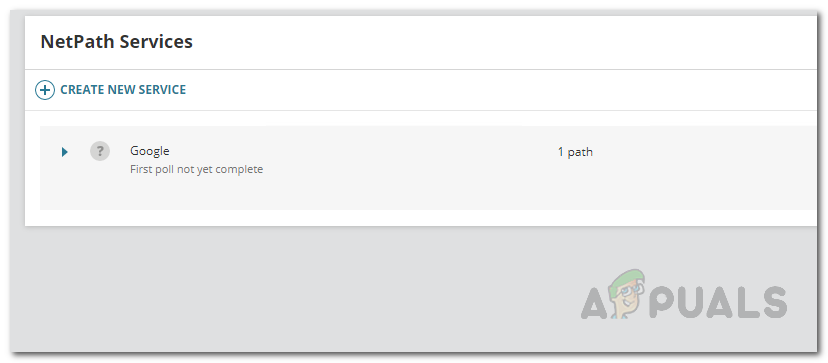
NetPath Services Page - First off, specify the service details of your destination device and ensure that the service is TCP-based. It is recommended that you provide the same information that is used by the users to access the application. This will help in NetPath getting the same service as users which would provide better insight.
- For the probing interval, we would recommend starting with 10 minutes. Once you have chosen your interval, click Next.
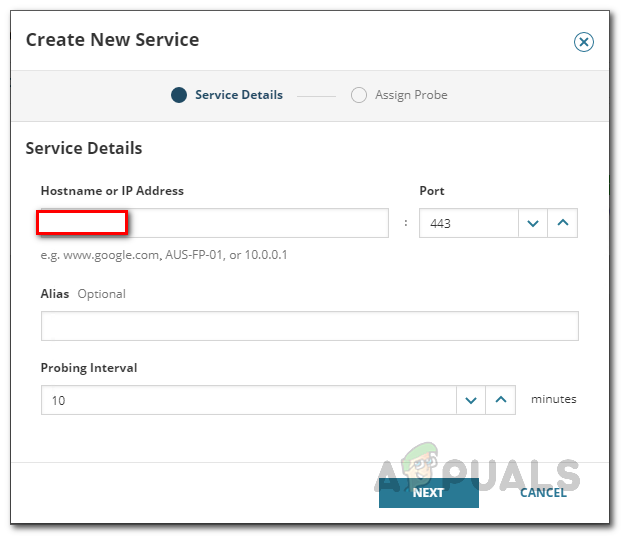
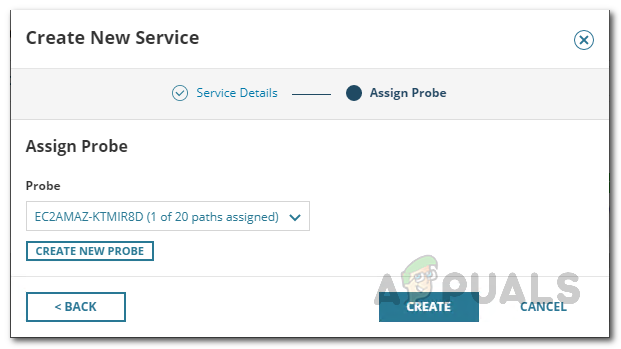
Providing New Service Details - Now, as we mentioned, the services are monitored by probes. We will be creating them down below.
- Finally, click the Create button to finish creating the service.
Creating the Service
Create a NetPath Probe
As it turns out, a probe is basically the source or the starting path that you are testing the application from. To make it easier, you can simply think of a probe as a user. It is best to deploy probes on the applications where you have users. Follow the instructions given down below to create a probe:
- First of all, make sure you are on the NetPath Services page.
- There, click the + icon next to a service to create a probe.
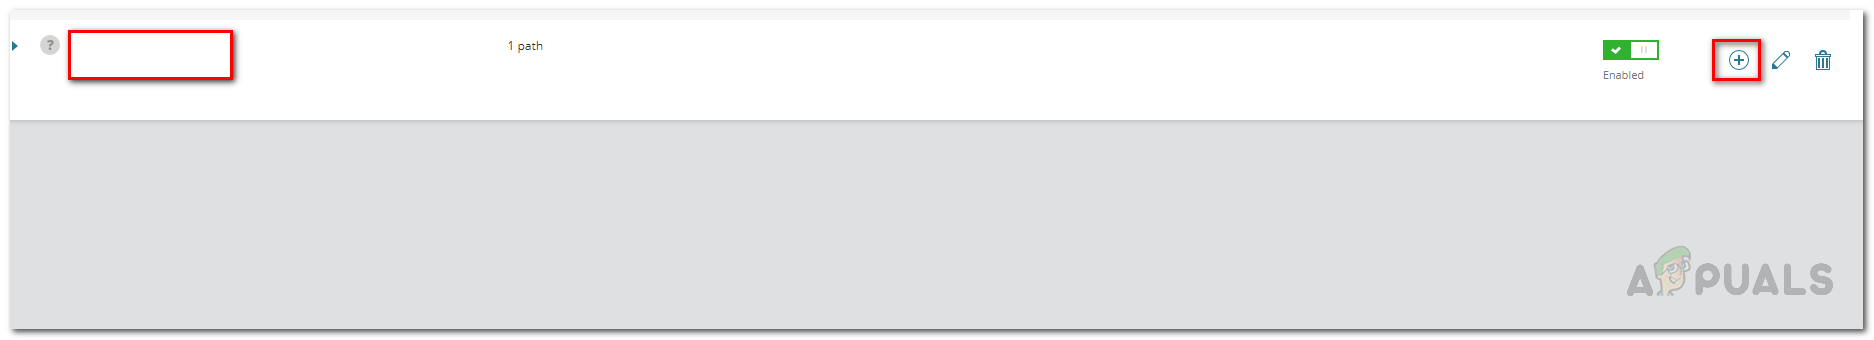
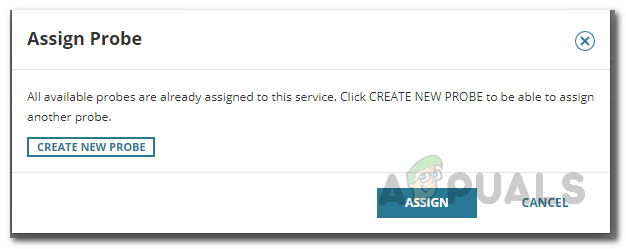
Assigning a New Probe to the Service - Then, click the Create New Probe button.
Creating a New Probe - Next up, you will have to provide the information that is required on the Create New Probe window. You will have to install the credentials that can be used to log in to the computer and install the required software.
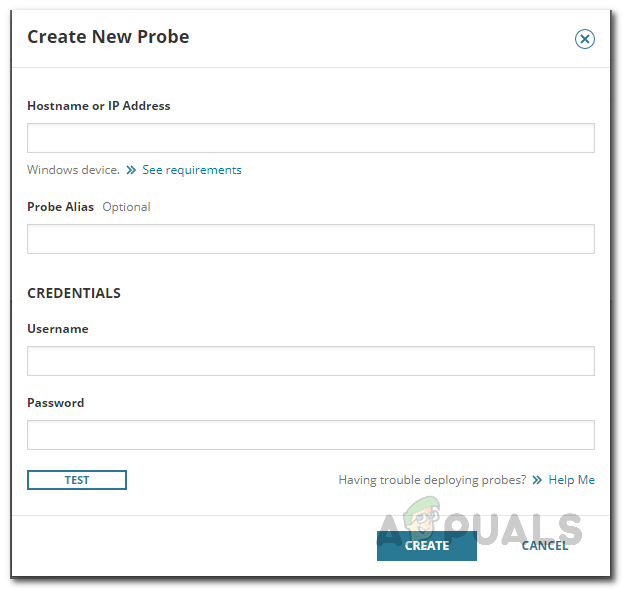
Providing Probe Details - Before creating the probe, you can test your source details by clicking the Test button. If the test is successful, you will be shown a Test successful message at the top.
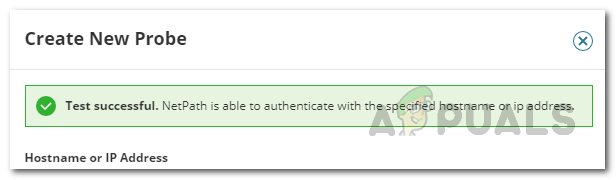
Testing Probe Credentials - Then, click the Create button.
- Once you have created a probe, you can assign it to the service by clicking the Assign button.
Viewing Visual TraceRoute
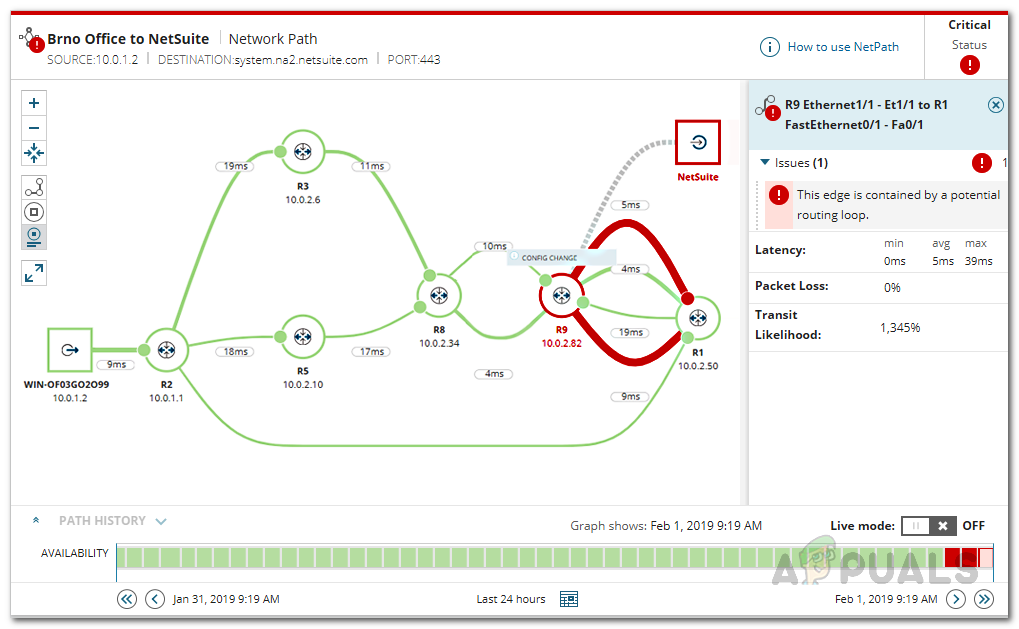
Now that we have successfully created a service as well as probes to monitor it, you are ready to view the visual traceroute of the service. On the left-hand side, you will see the probe or the starting path whereas the destination device resides on the right-hand side. The the transit is basically everything that is in the middle. To view the network path, follow the instructions given down below:
- First of all, click on My Dashboard and then choose NetPath Services from the drop-down menu.
Navigating to NetPath Services - On the page with all of your created services, click on one of the probes that you have assigned to the service to view the network path of the service.
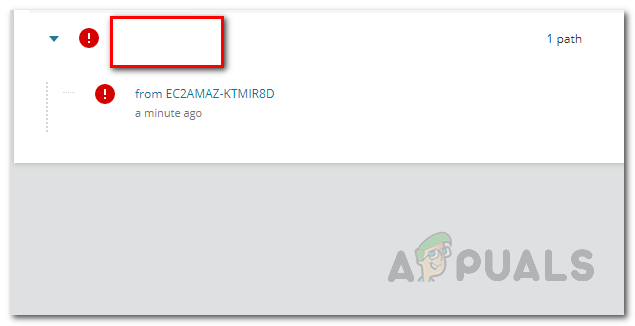
Opening up the NetPath - With the help of this, you will be able to monitor your applications in a better way as it notifies you of any changes that take place in the network.
NetPath - You can change the amount of detail shown on the screen by clicking the icons on the left.
NetPath Additional Buttons to Change the Details - In addition, you can click on a node in the graph to see additional information about a specific node in the network path.