How to Create an Executive Dashboard for NOC Team
Creating Network Specific Executive Dashboard for Network Operations Center Team
Dashboards are visual interfaces that provide more visibility of all your data at a glance. Dashboards are beneficial in many ways. Real-time data can be viewed, and critical metrics important to the team can be displayed. Solarwinds provides options to create customizable dashboards that can help network and system administrators. Team-specific exclusive dashboards can be made using Solarwinds out-of-the-box widgets or our using custom widgets available.
In this article, let’s see how to create a dashboard like the one below.
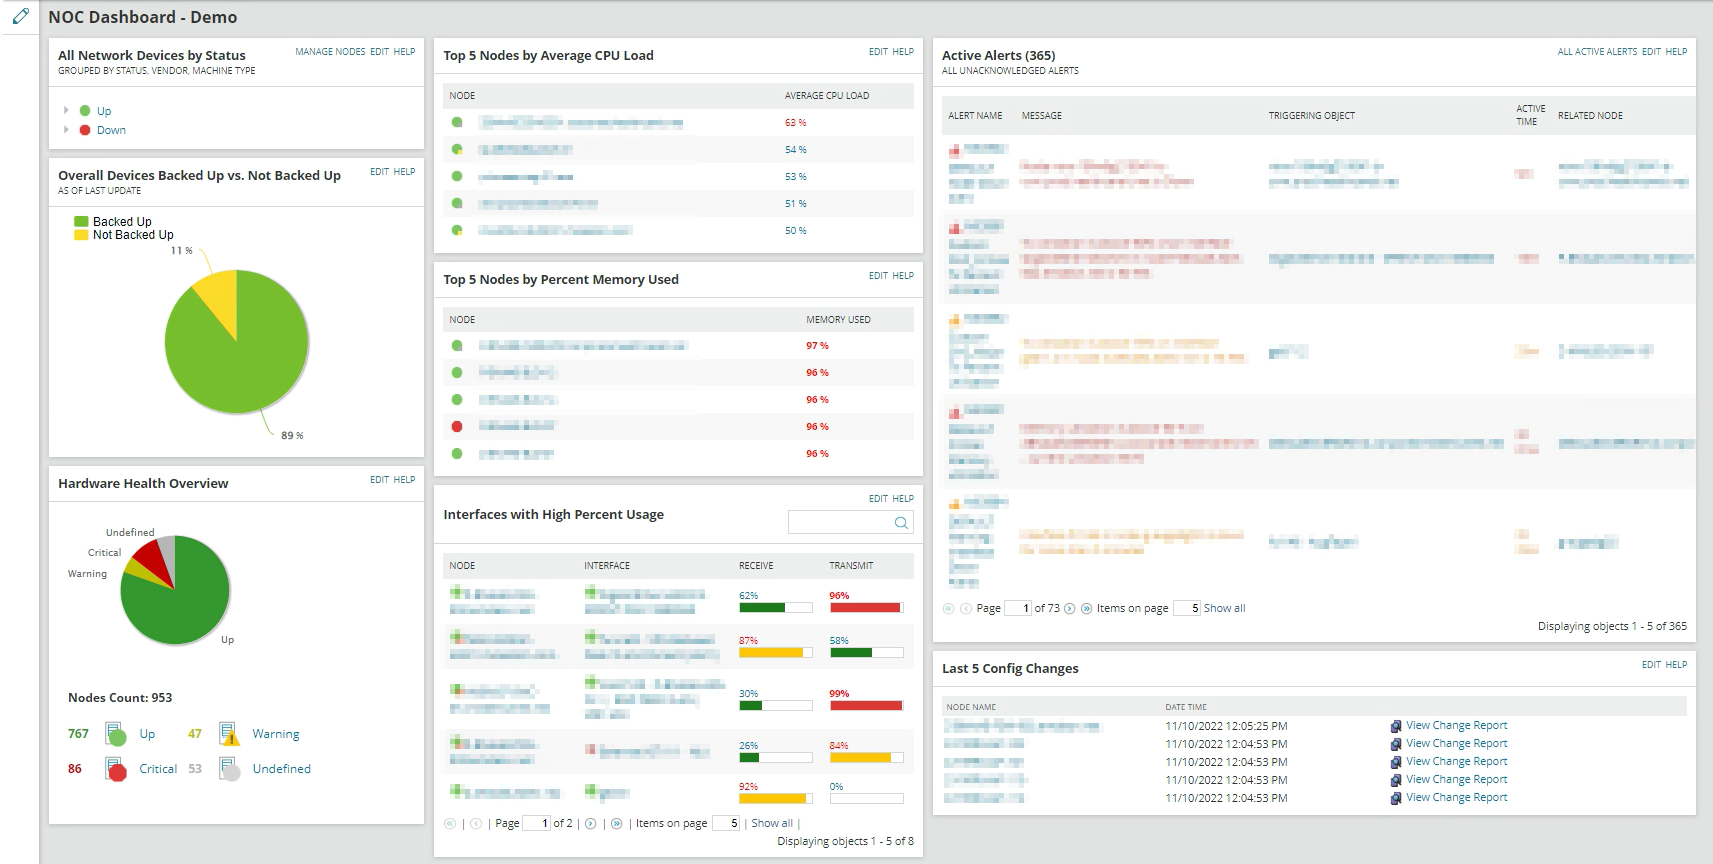
Below are the custom widgets we are going to place on this dashboard.
- All Network Devices by Status.
- Network Device’s Config Backed-up vs. Not Backed-up
- Overall Hardware Status.
- Top 5 Network Devices by Average CPU.
- Top 5 Network Devices by Average Memory.
- Top 5 Interfaces with High Percent Usage.
- Active Alerts.
- Recent Config Changes.
Creating Dashboard for NOC Team
Follow the below steps to create the dashboard for the NOC team.
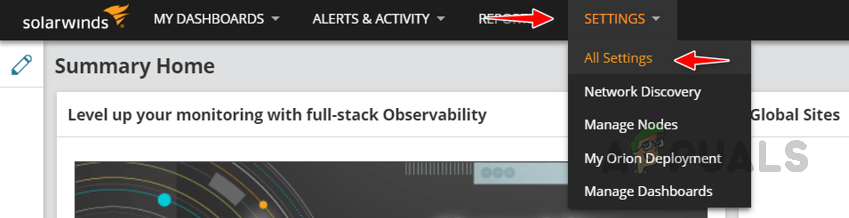
- Login into your Solarwinds web console.
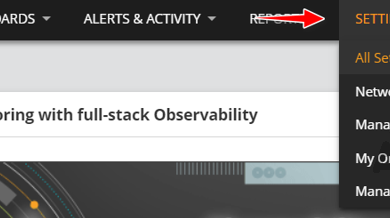
- Go to Settings and then All Settings.
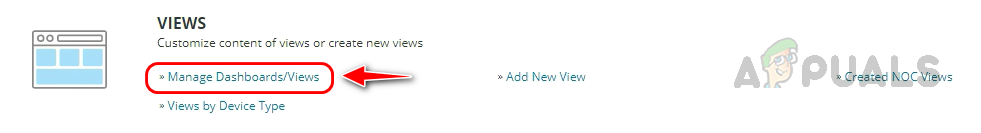
- Click on Manage Dashboards/Views under Views.
- Click on Add classic dashboard.
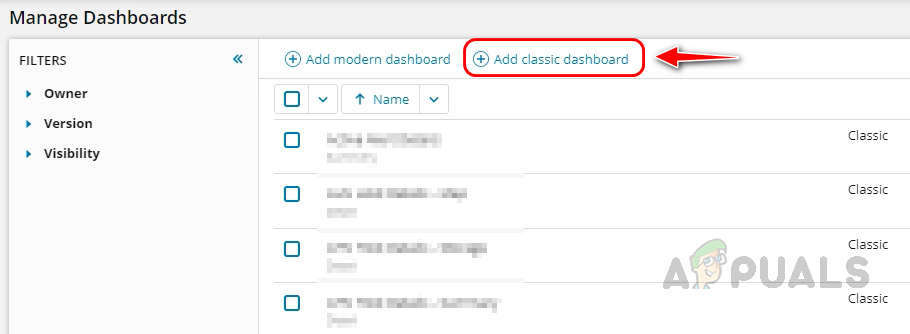
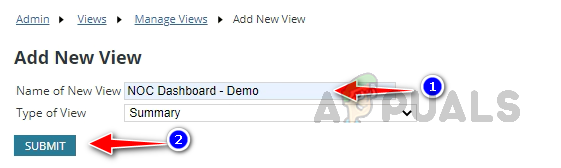
- Provide an appropriate name for the dashboard and click on submit.
Now we will be redirected to the dashboard creation page. Let’s see how to create the widgets mentioned above for the dashboard.
1. All Network Devices by Status
Follow the steps below to create a widget for all network devices by status.
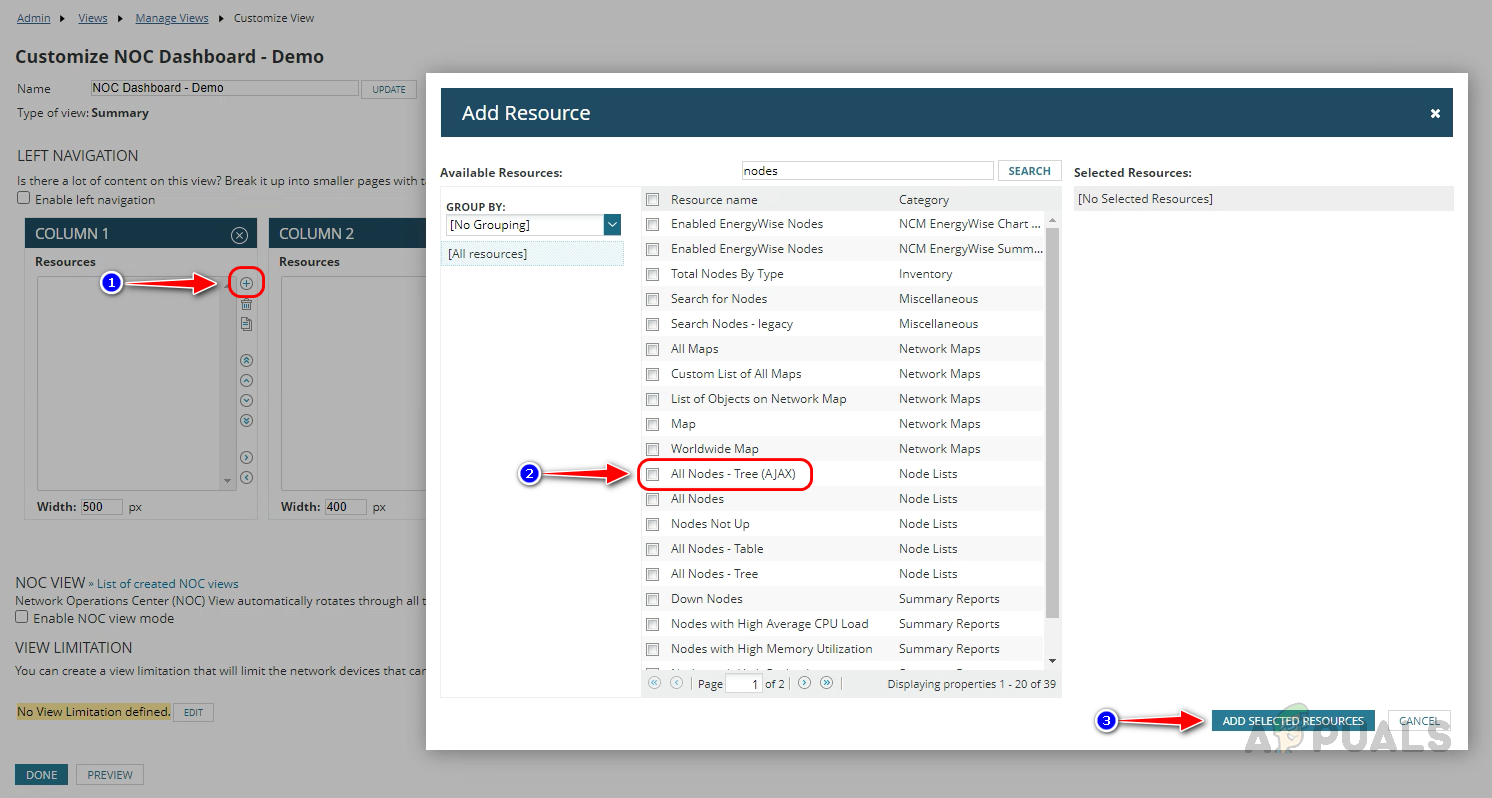
- Click on the + icon, search for nodes in the Add Resource window, select All Nodes – Tree (AJAX), and click on add selected resources.
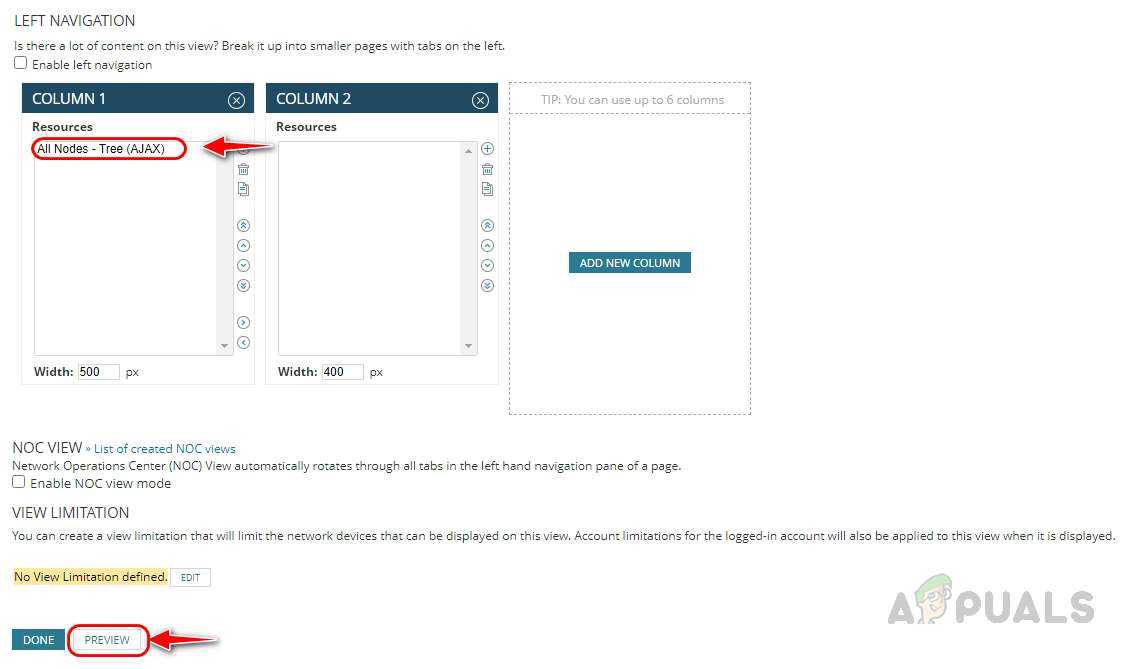
- The selected widget has been added now. To customize the widget, click on Preview.
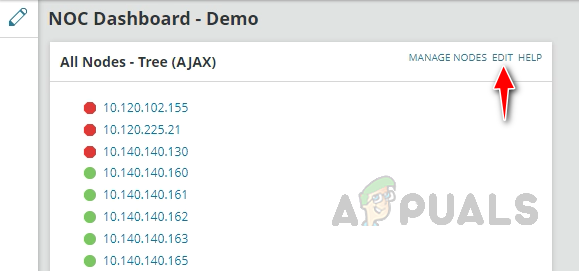
- Click on Edit in the all-nodes widget.
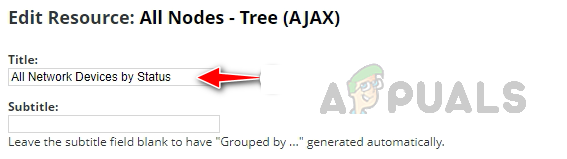
- Provide an appropriate name for the widget.
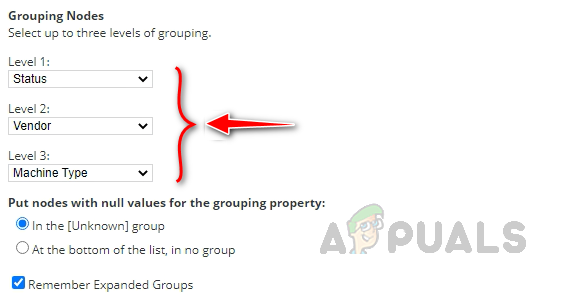
- Use the Grouping Nodes section to group the nodes based on our needs, and here we will group the nodes by status, choose Status in Level 1. Choose other levels based on your needs.
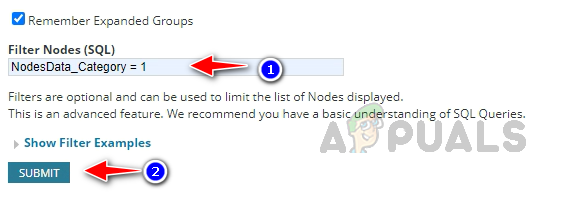
- Since we are creating this widget for network devices, we need to filter the network devices. We can use the default property category to filter the network devices. Use the below query in Filter Nodes (SQL) section to filter the network devices and click on Submit.
NodesData_Category = 1
Here 1 represents the network devices. These values can be identified in the Solarwinds database.
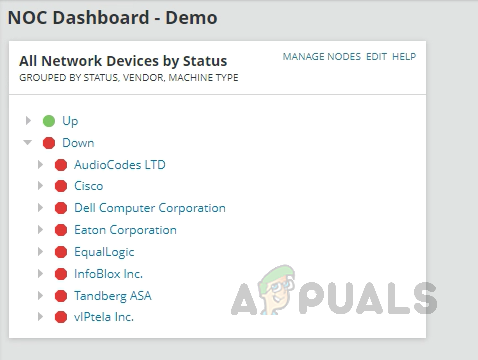
- Now our first widget is ready. You can expand the groups to find the devices up/down state.
2. Network Devices Config Backed-up vs. Not Backed-up
Let’s add our second widget to show the difference between the config-backed and not-backed-up devices.
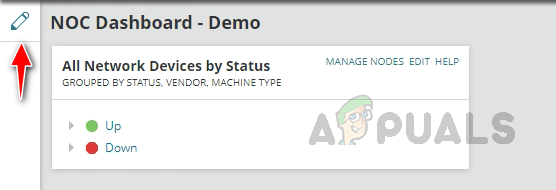
- Click on the Pencil icon on the same page to add a new widget.
- Click on Add Widgets and search backed up. You can see the widget for backed up vs. not backed up. Drag and drop the widget wherever you want on the dashboard.
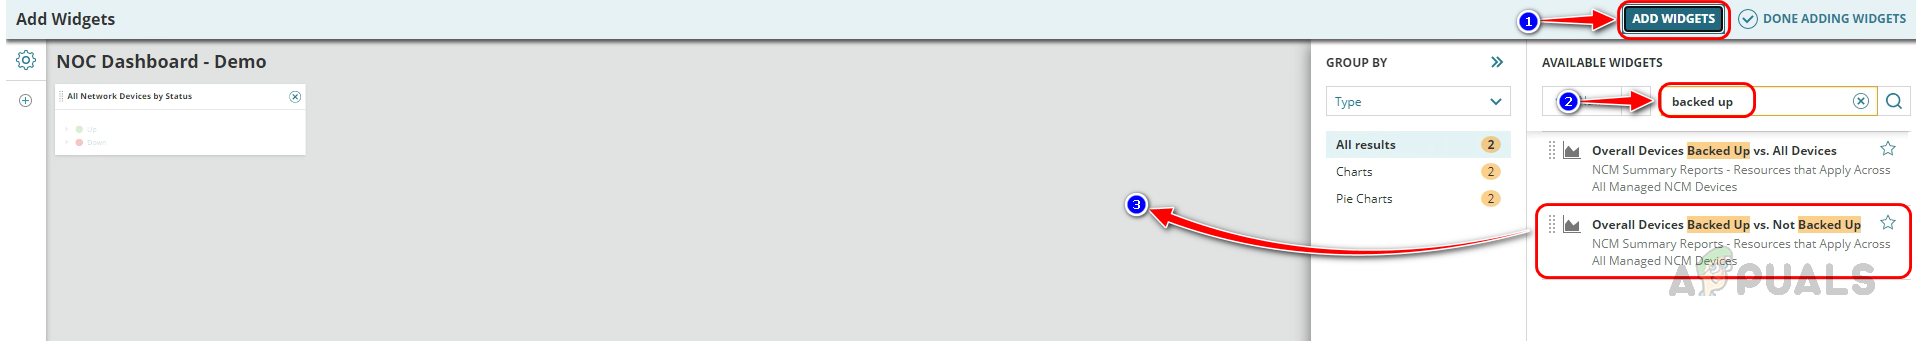
- The widget will be added to the dashboard now.
3. Overall Hardware Status
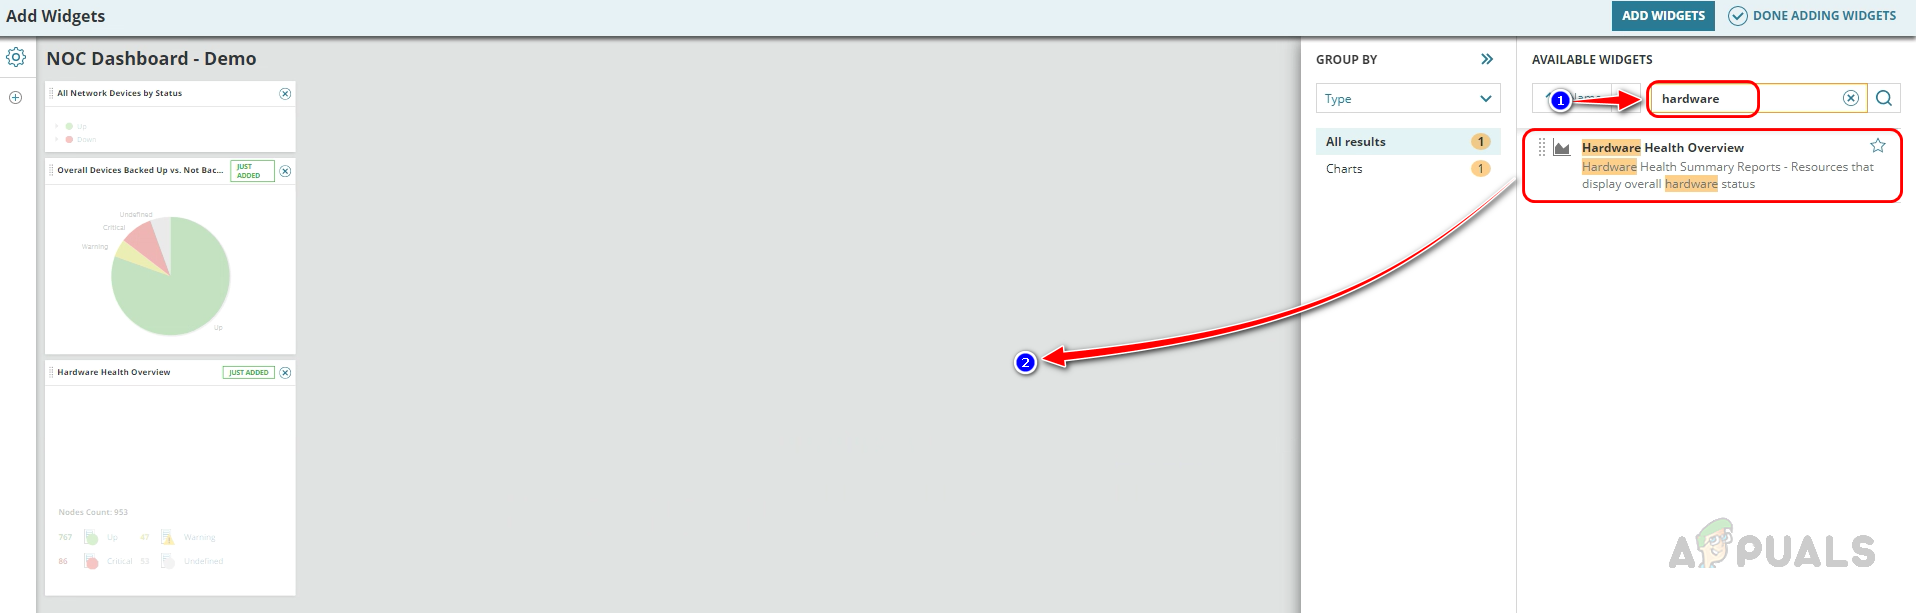
Now let’s add a hardware status widget. Search hardware and drag and drop the Hardware Health Overview widget on the dashboard.
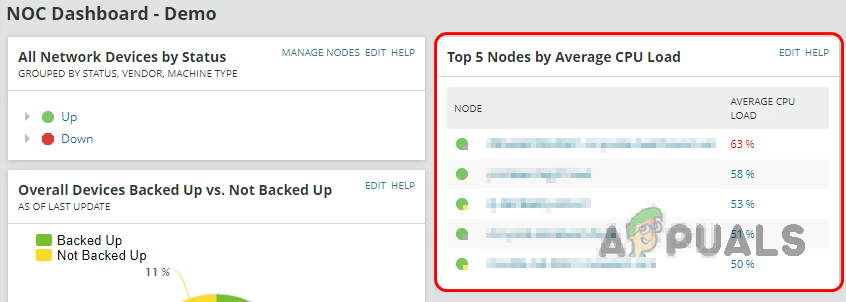
4. Top 5 Network Devices by Average CPU Load
To add the top 5 CPU-consuming network devices, follow the below steps.
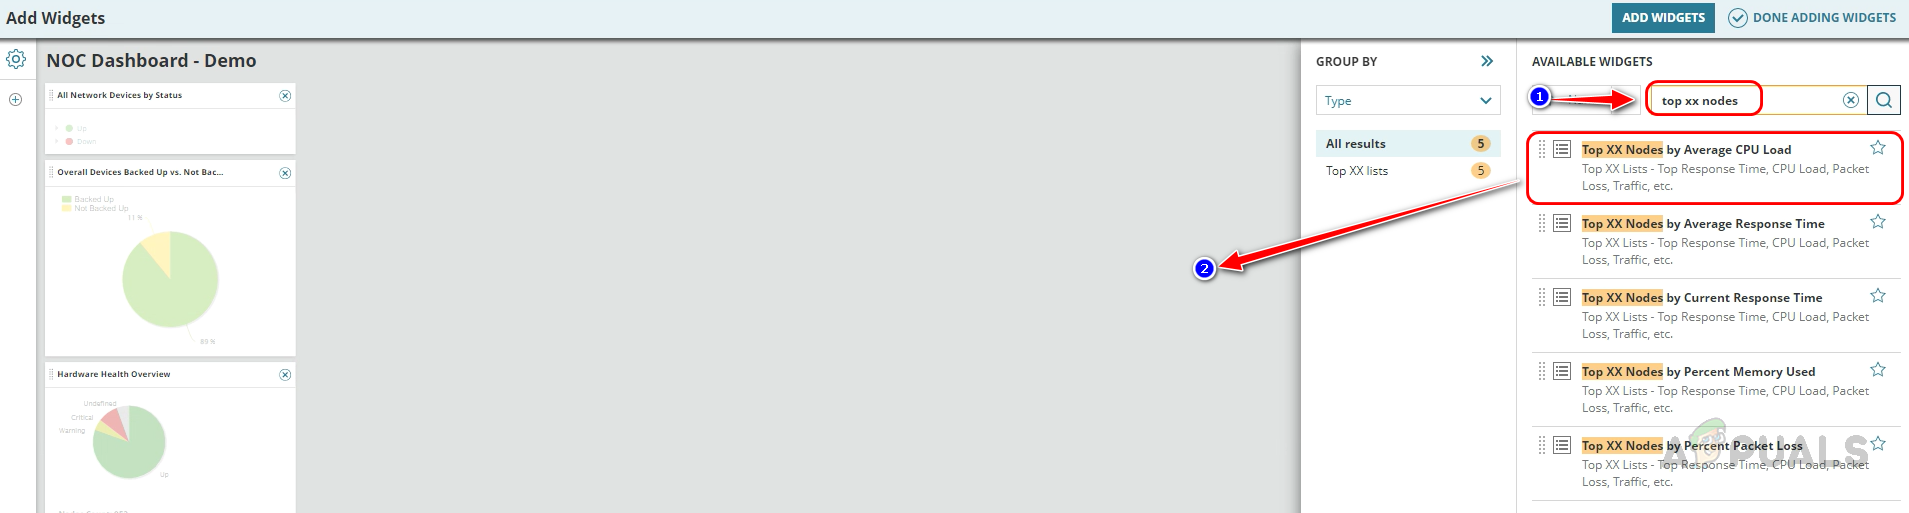
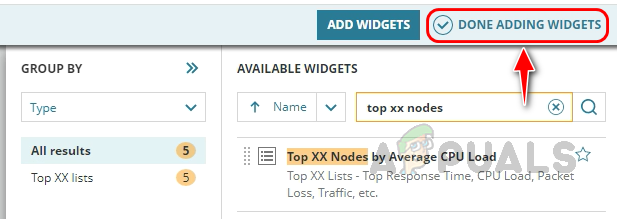
- Search for top xx nodes, and drag and drop the Top XX Nodes by Average CPU Load on the dashboard.
- Click on Done Adding Widgets.
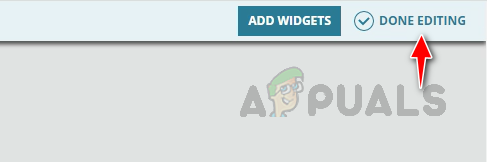
- Click on Done Editing.
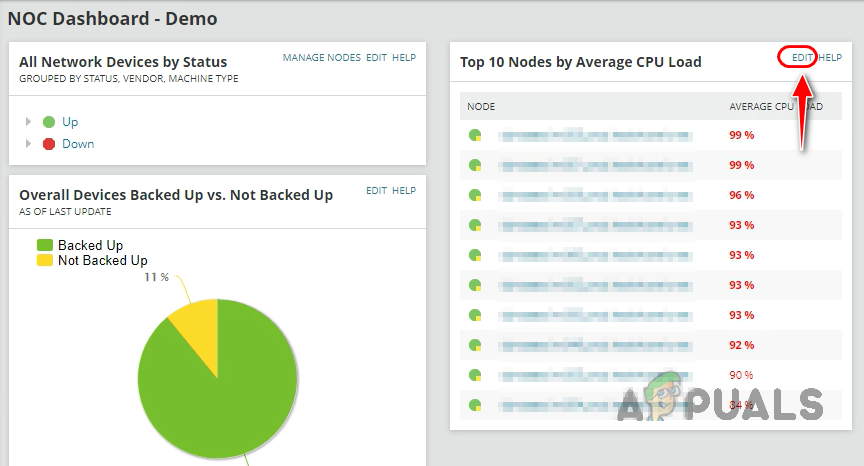
- Click Edit on the CPU load widget.
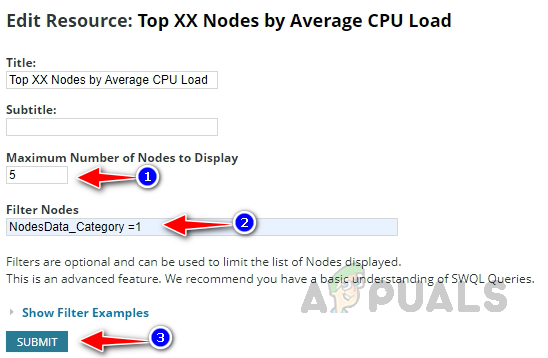
- Since we will show only the top 5 nodes, enter 5 in the Maximum Number of Nodes to Display text box. You can increase or decrease the number based on your needs. Use the same SQL query to filter the network devices and click on Submit.
NodesData_Category = 1
- The top 5 nodes with high CPU load will be displayed in the widget now.
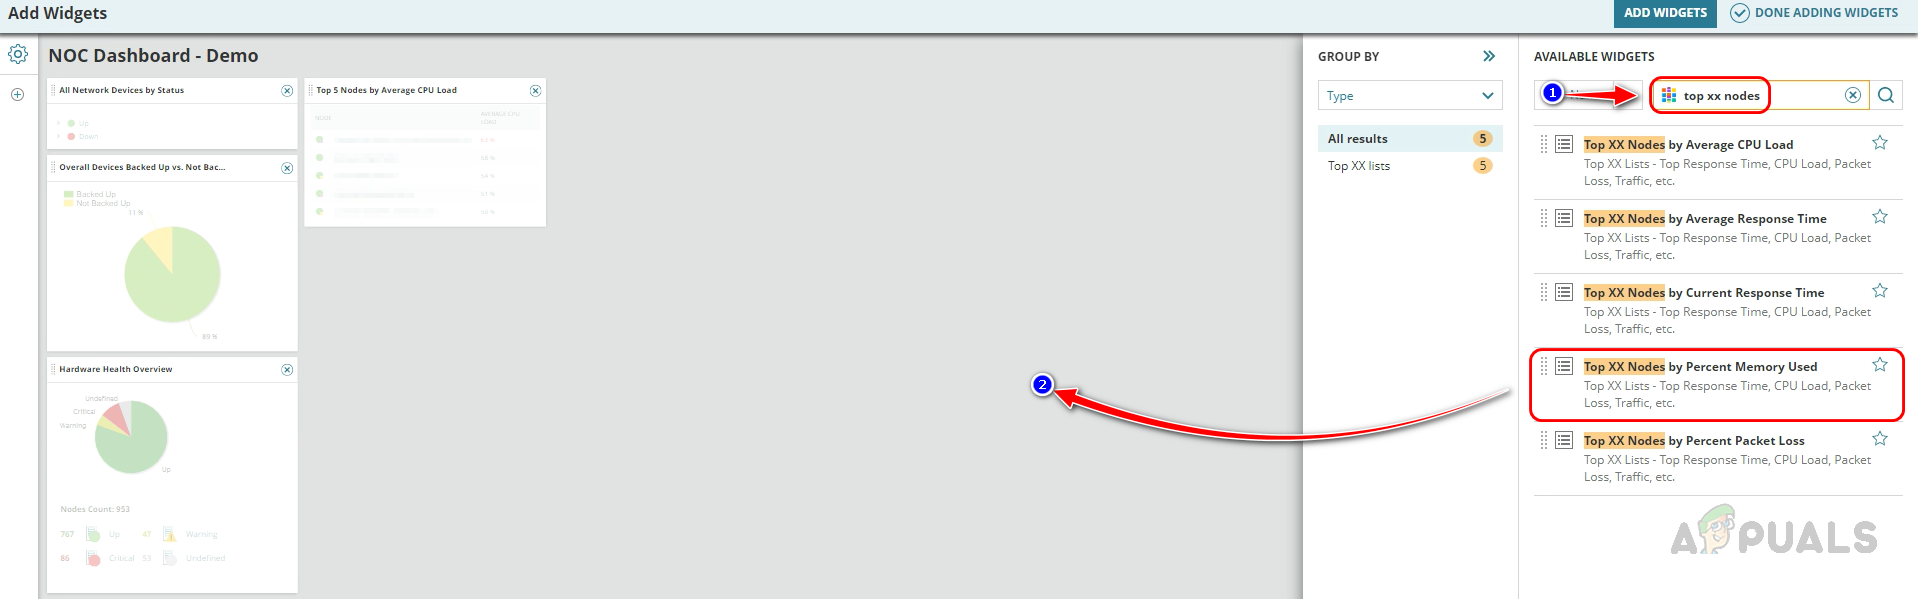
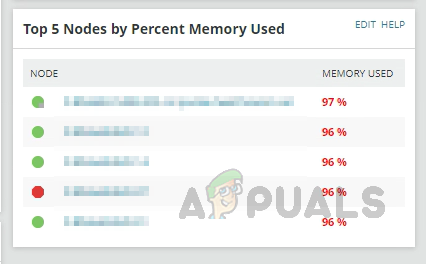
5. Top 5 Network Devices by Average Memory
To add the top 5 network devices consuming more memory, follow the same steps above. Search top xx nodes and drop the Top XX Noe by Percent Memory Used widget on the dashboard.
 Follow the same steps to show only 5 devices and use the same SQL query to filter network devices.
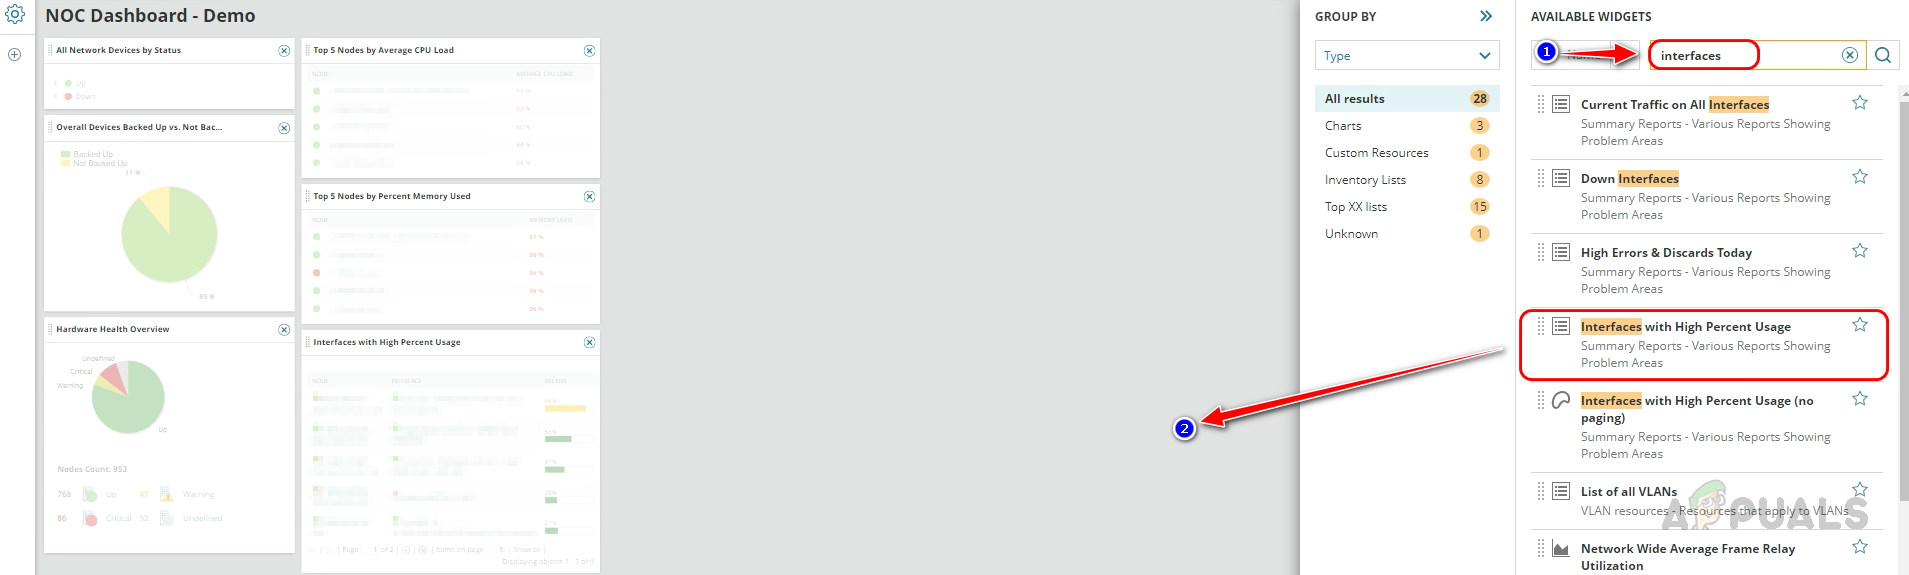
6. Top 5 Interfaces with High Percent Usage
To add the interfaces consuming high bandwidth, search interfaces in the search box. Drag and drop the Interfaces with High Percent Usage widget. By default, this widget shows 5 interfaces. You can increase or decrease the interface count if required.
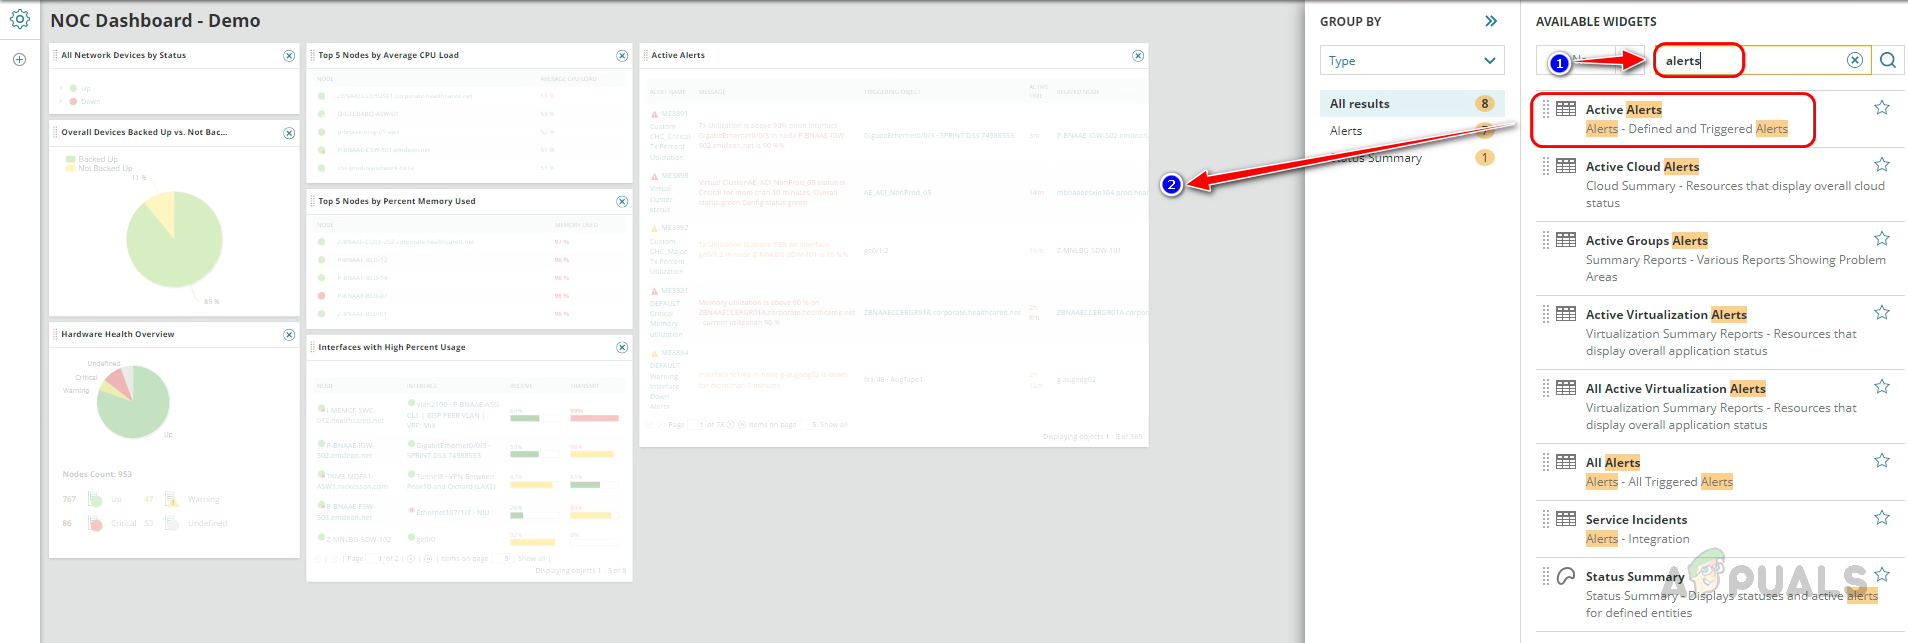
7. Active Alerts
To show the active alerts widget on the dashboard, search for alerts in the search box. Drag and drop the Active Alerts widget on the dashboard. We don’t have a filter option for the active alerts widgets, hence all the active alerts will be shown in this widget.
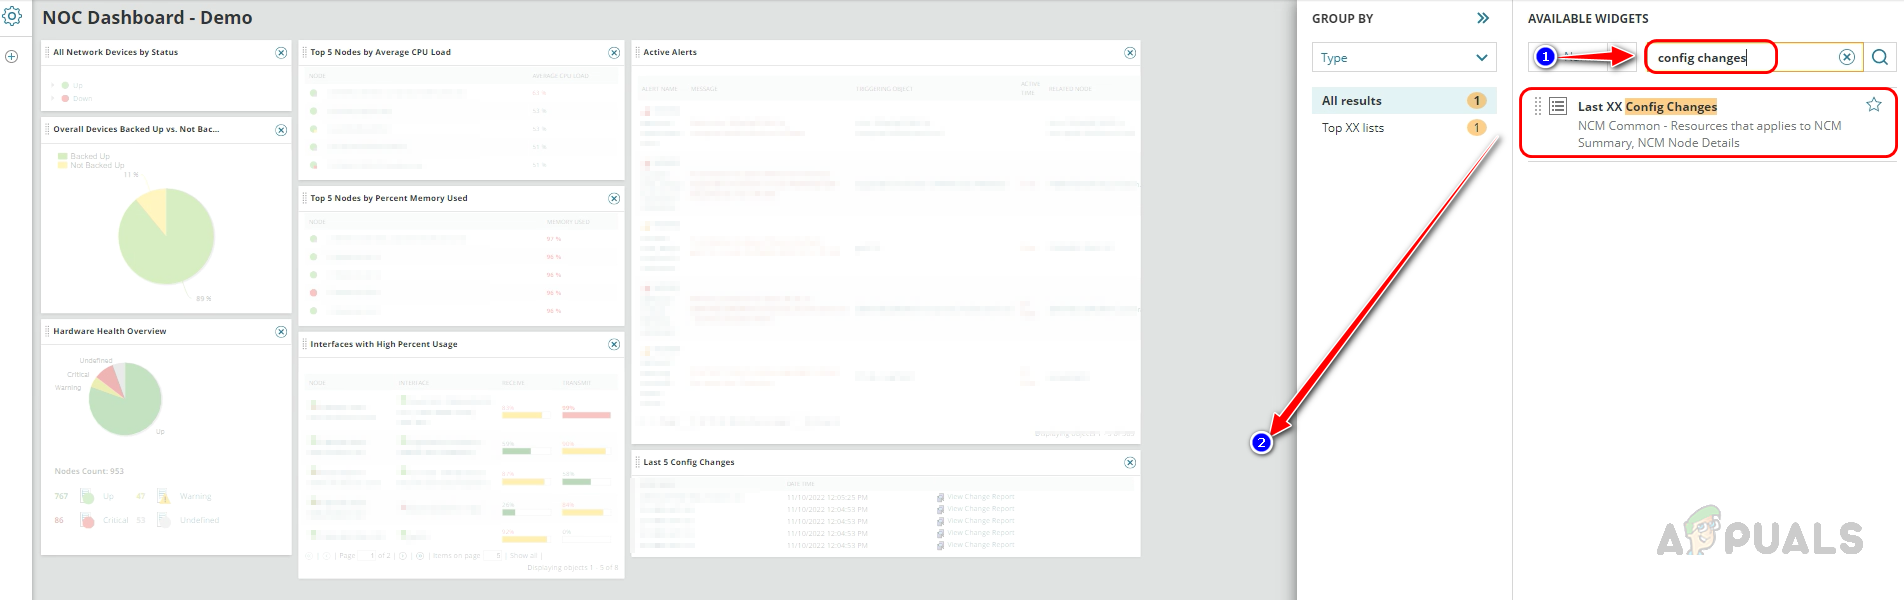
8. Recent Config Changes
To show the recent configuration changes on the network devices. Search for config changes in the search box. Drag and drop the Last XX Config Changes widget. By default, the widget shows the last 5 config changes. This can be increased or decreased based on the needs.
We have added all the required widgets for our dashboard. Now click on Done Adding Widgets and Done Editing. Here’s the dashboard we created for the network team. Widgets available in the dashboard are interactive, we can expand the groups, and if we click on any of the nodes or parameters, it will take us to the related page where we can find more details about the same.
We can share the URL with the team or add this dashboard to our Solarwinds navigation menu so that anyone from the network team can access the dashboard.
How to Add Created Dashboard to Solarwinds Navigation Menu
Follow the below steps to add the dashboard to the Solarwinds navigation menu.
- Go to My Dashboards and click on Configure.
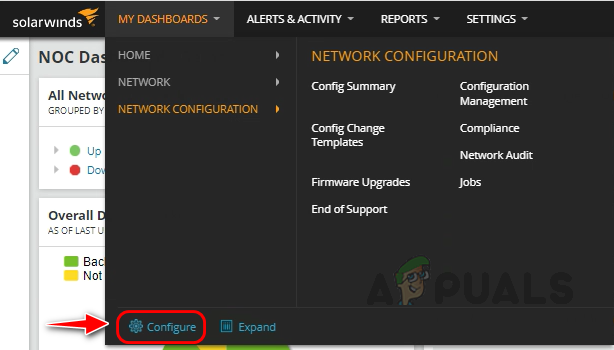
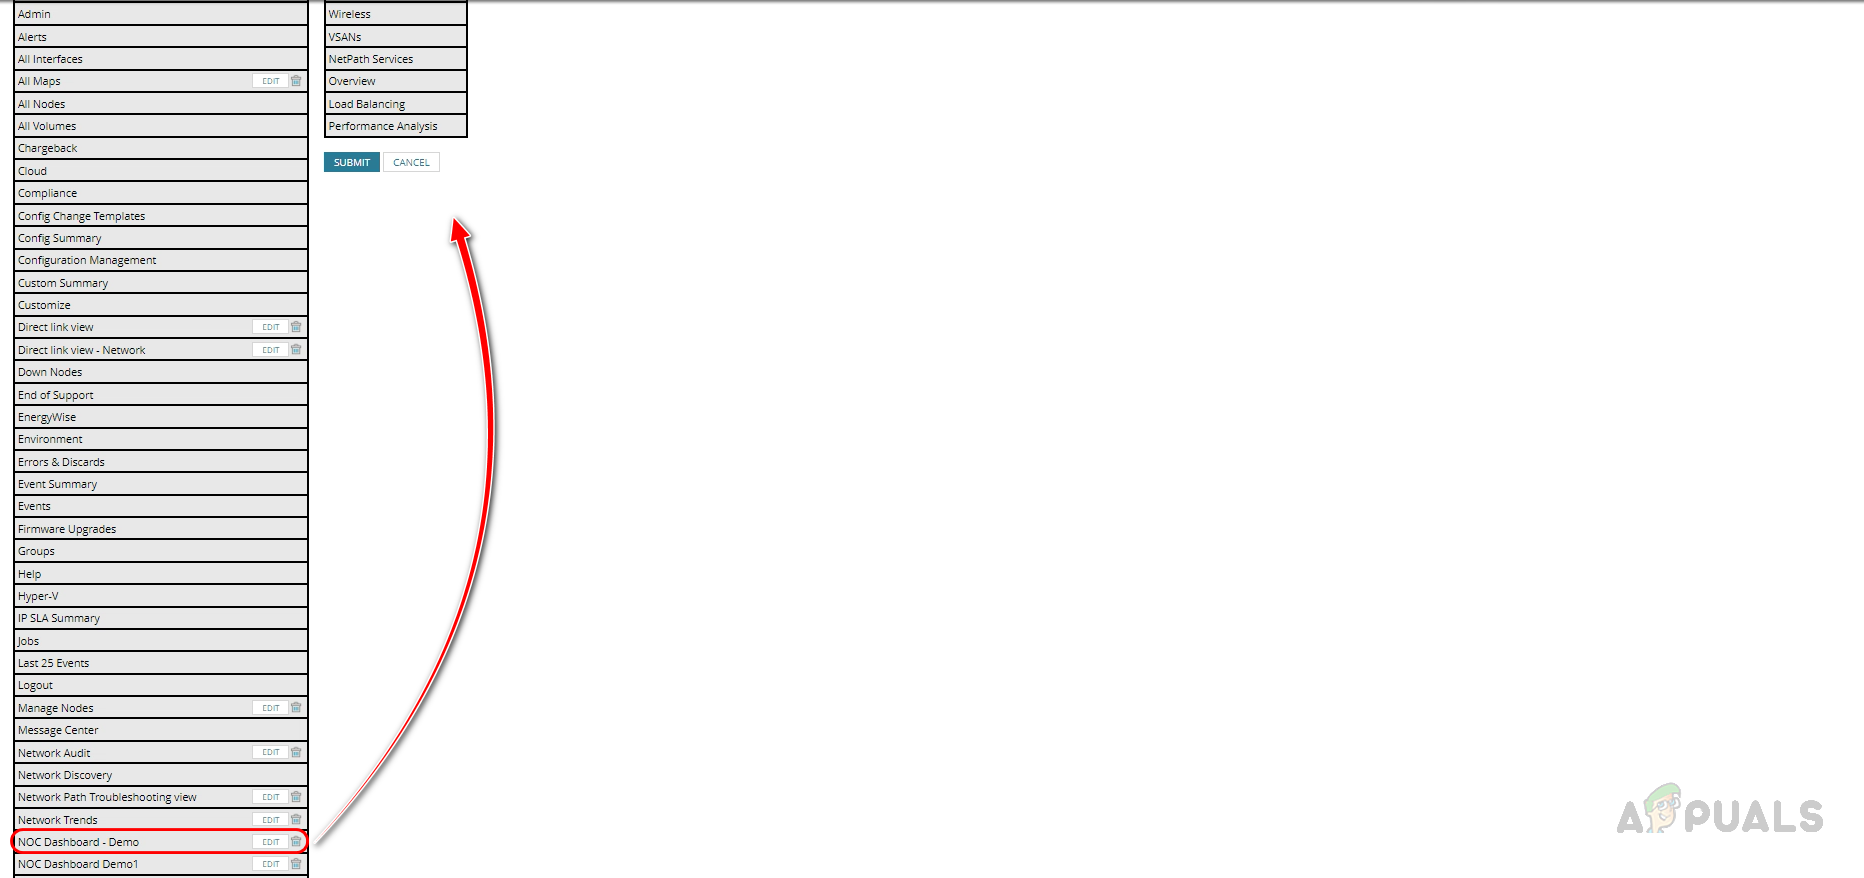
- Click Edit on which menu you want to place the dashboard. Since It was created for the Network team, I am placing it inside the Network Menu.
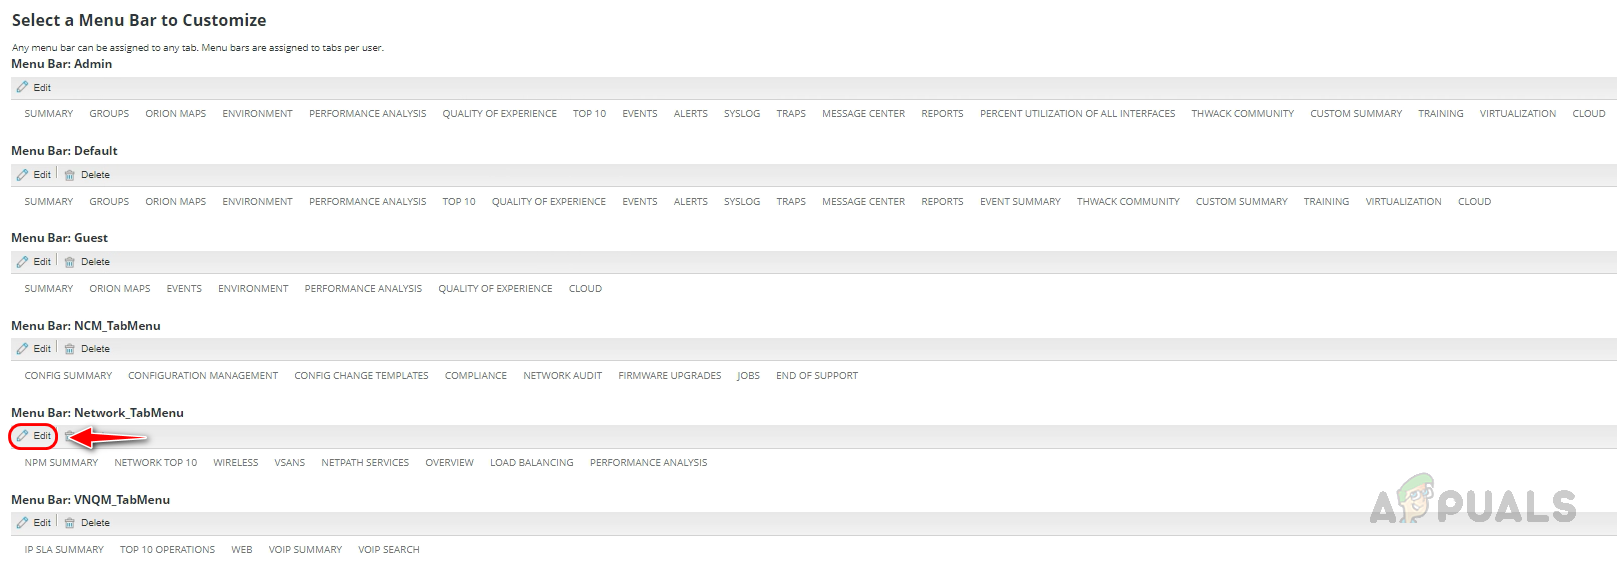
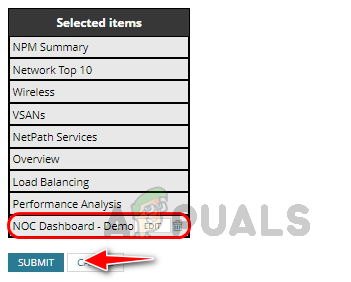
- Find the dashboard created for the Network team, and drag and drop the dashboard on the existing menu item.
- Once the dashboard is placed on the menu, click on Submit.
- Now we can find our dashboard in the Solarwinds navigation menu bar.
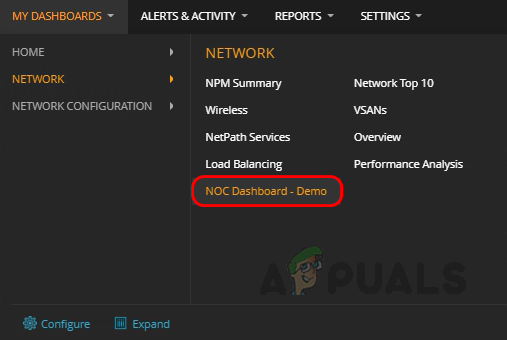
We can use the Solarwinds navigation menu to access our dashboard. This is how we can create a custom dashboard for a specific team and add it to the Solarwinds menu bar. There are lots of pre-defined widgets available in Solarwinds. We can customize them based on our needs to create an executive dashboard. We can use executive dashboards to monitor all the network infrastructure devices in a single pane. To try and learn more about Solarwinds, click on this link.