How to Monitor Availability and Measure Latency of Devices on your Network in Realtime?
Performance Testing your Network Infrastructure in Realtime
Network performance is always one of the biggest concerns of a network administrator. A network admin has to take different measures to ensure maximum performance of the network which includes monitoring the important aspects of the network like servers and other network devices. To be able to better monitor a network and keep its performance optimum, a network admin always has to know about the devices that are present in his environment and which of the said devices are available. Another factor that comes in here and needs to be taken into consideration is the latency of the devices that are available which is really important.
As it turns out, there are tools available in this digital and software world that will help you in monitoring the real-time availability of various devices as well as obtain the latency of the said devices to be presented. One of these tools is developed by Solarwinds which is a company with utter dominance over the network and system management world because of the quality of products that they develop for such purposes. Most of the tools developed by Solarwinds are industry-favorite and used by almost every network engineer in their career. Engineers Toolset is no exception in this case.
Download the Response Time Monitor
Solarwinds Engineers toolset (download here) is a suite of tools that provides over 60 tools to network admins that help in your daily network management. Finding the right tools for your networking tasks should not be hard and that is exactly why they’ve developed this tool. Engineers Toolset comes packed with a whole lot of features that allows you to monitor your network in real-time as well as an alert system that notifies you whenever something goes wrong.
With the help of the automated network discovery features, you are able to utilize tools like Switch Port Mapper that helps you track and troubleshoot endpoint devices and much more.
To follow through this article, you will have to download and install the Engineers Toolset on your system. The installation process is very simple and does not require any specific configuration since you can be done with it just by a few clicks. They also offer a 14 days evaluation period if you wish to test the product before you buy it.
What is the Response Time Monitor?
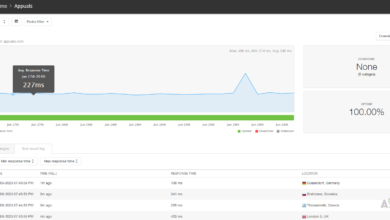
Response Time Monitor is a tool that comes packed in the Engineers Toolset which lets you analyze and determine the availability as well as the latency information for multiple devices. With the help of the Response Time Table, you will be able to see your available devices in a tabular form which can be really useful while managing a network. In addition to that, using Response Time Monitor, you will be able to create custom thresholds for your devices along with receiving information like device name, IP address, availability of device and more.
Monitoring Availability and Latency of Devices in your Network using RTM
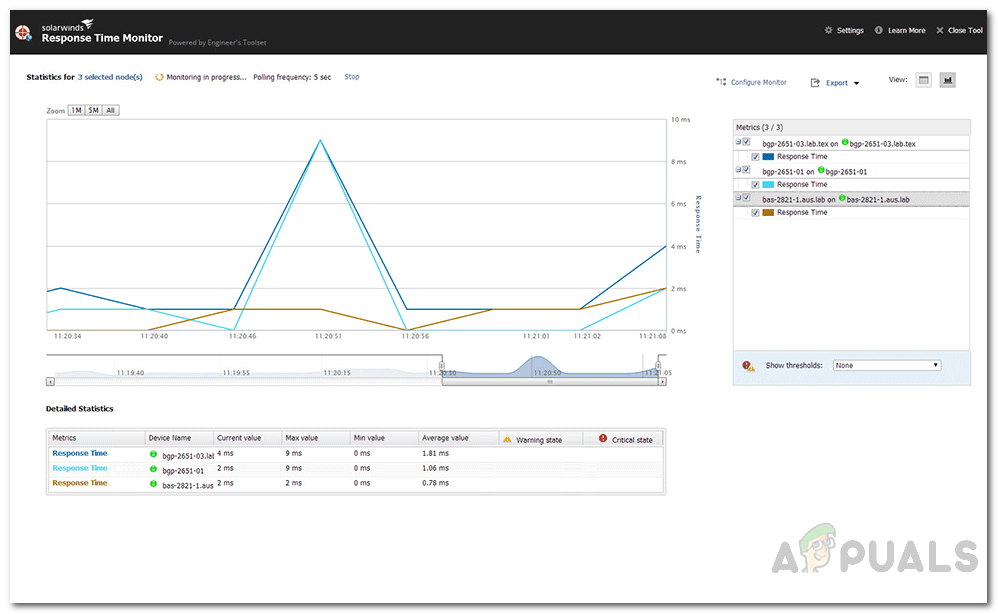
As we have mentioned above, network devices have to be monitored and their latency as well as availability has to be checked on regular intervals by network admins for optimum performance of the said network. To demonstrate this, we will be using the Response Time Monitor tool. Therefore, without further ado, let us get into it.
- First of all, open up the Engineers Toolset by going to the Start Menu and typing Toolset Launch Pad.
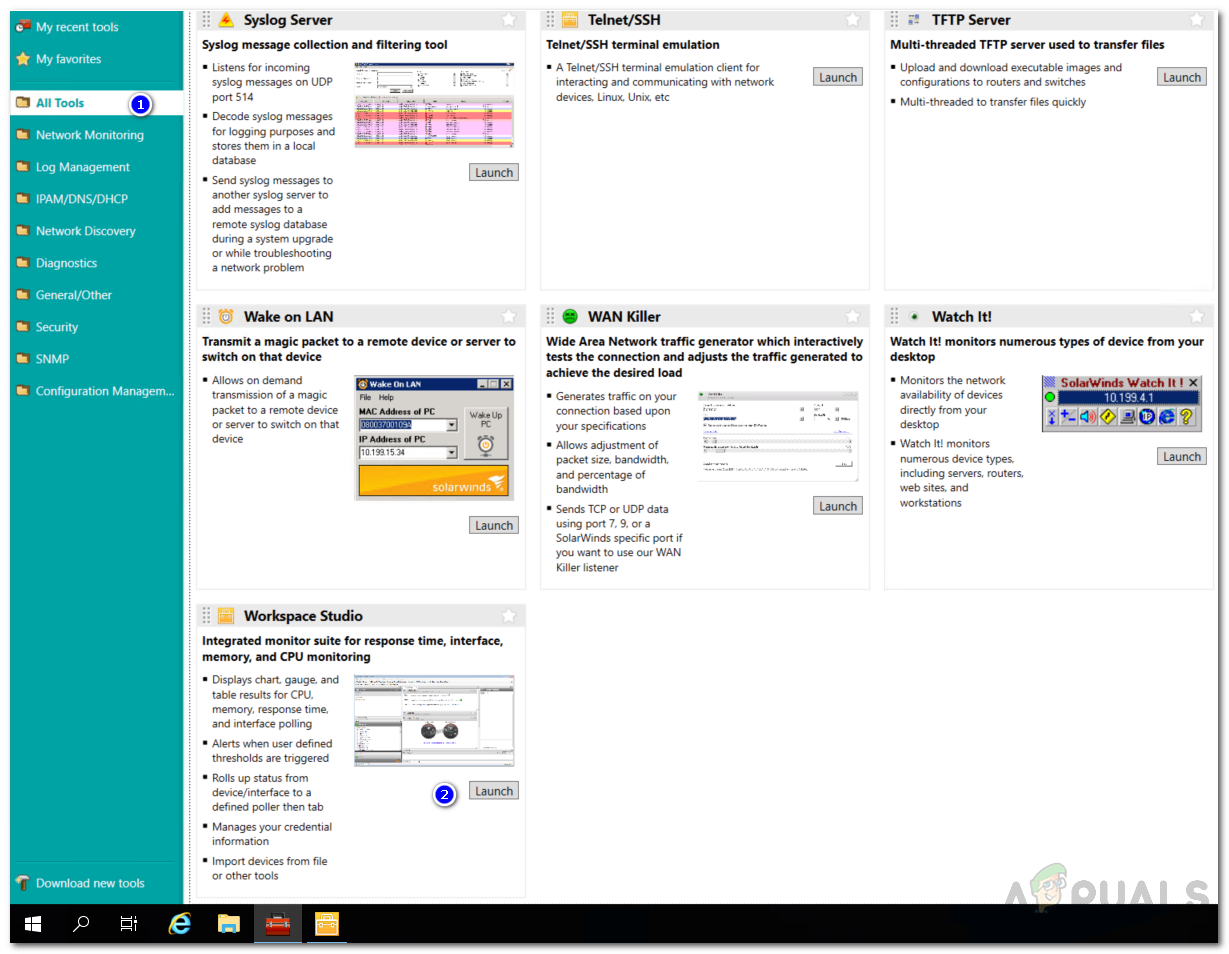
- Then, on the left-hand side, click on the All Tools option. After that, scroll all the way down and click the Launch button for the Workspace Studio tool. Alternatively, an easier way of doing this would be to just search for Workspace Studio using the search field provided.
Workspace Studio - Once you have launched the Workspace Studio, you will be shown the Getting Started tab. Now, first of all, you will have to add your device to Workspace Studio.
- To do this, either click on the Add Device option on the Getting Started tab or just click the + icon in front of the Devices on the left-hand side.
- You will be prompted with the Add New Device window. Here, provide the IP address of the device you wish to monitor and follow it up by selecting a credential.
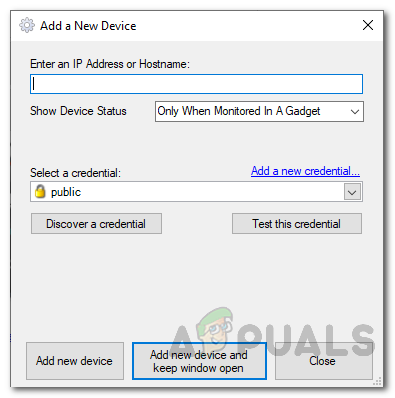
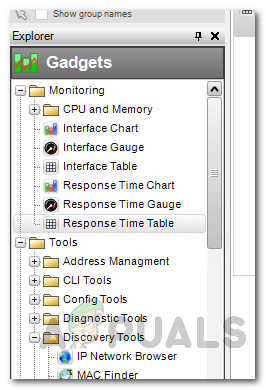
Adding New Device - Once you have added the device, you will now have to create new tabs with the Response Time Monitor tools. These are Response Time Chart, Response Time Table and Response Time Gauge.
- You can find them in the Gadgets box under Monitoring. Drag one of these tools and release it in the tabs area (next to the Getting Started tab).
Response Time Tools - After that, you can drag and drop the rest of the two tools in the same tab so you have all the information in the same place.
- Now that you have organized the tools, it is time to add the devices to it. To do this, just click and drag your device to each of the tools and it’ll begin monitoring.
- Give it a few seconds to collect the data and then you’ll be able to see the graphs and the table.
Configuring Response Time Tools
Now that you have added your devices to the Response Time tools, you can have it spit even more information as well as modify thresholds and titles of each tool. This is pretty easy to do and we will go through each tool.
Setting up Thresholds
- Click the drop-down icon on the Response Time Chart tab and then click Gadget Settings.
- To change the title of the tool, switch to the Set Monitor Title and provide the details.
- To modify the thresholds or create your own, go to the Modify Thresholds tab.
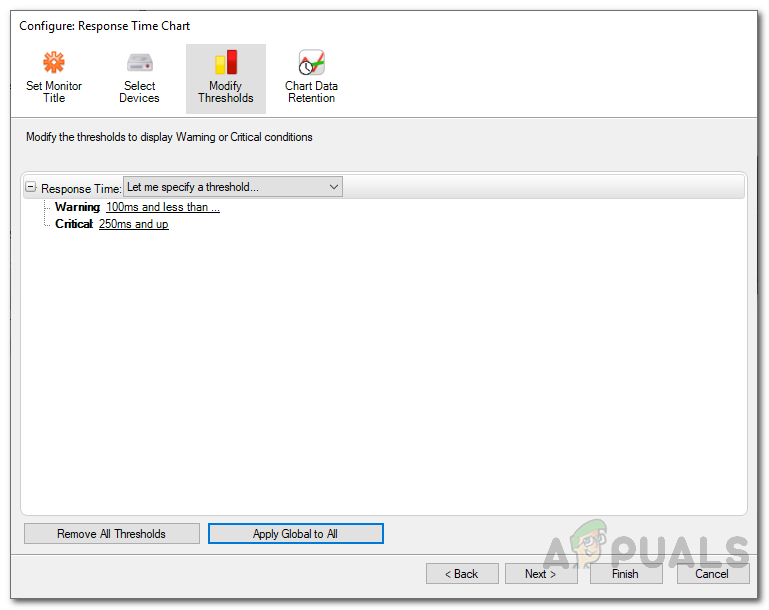
Modifying Thresholds - There, click on the drop-down menu and choose Let me specify a threshold and then provide your own values for Warning and Critical. You can also choose to not have any thresholds using the provided the option. Otherwise, you can just stick to the global values.
Creating Custom Layouts and Selecting Fields
- Go to the Gadget Settings by clicking the drop-down menu and then selecting the said option.
- If you wish to see more data in the table, you can do so by going to the Edit Table Columns tab.
- To add a new column, just choose whatever extra detail you wish to see on the left-hand box and then click the right arrow key to move it to the right-hand box. Then, click Finish to save the settings.
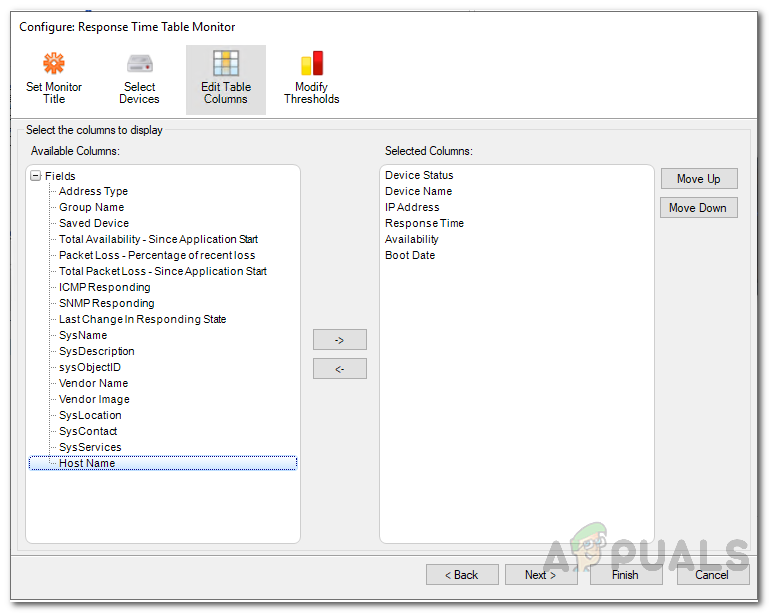
Adding New Columns - Additionally, you can also set thresholds via the Modify Thresholds tab as described in the above instructions.
Creating Response Time Gauges (Monitors)
- Go to the Gadget Settings using the instructions provided above.
- Here, you can change the gauge properties by going to the respective tabs.
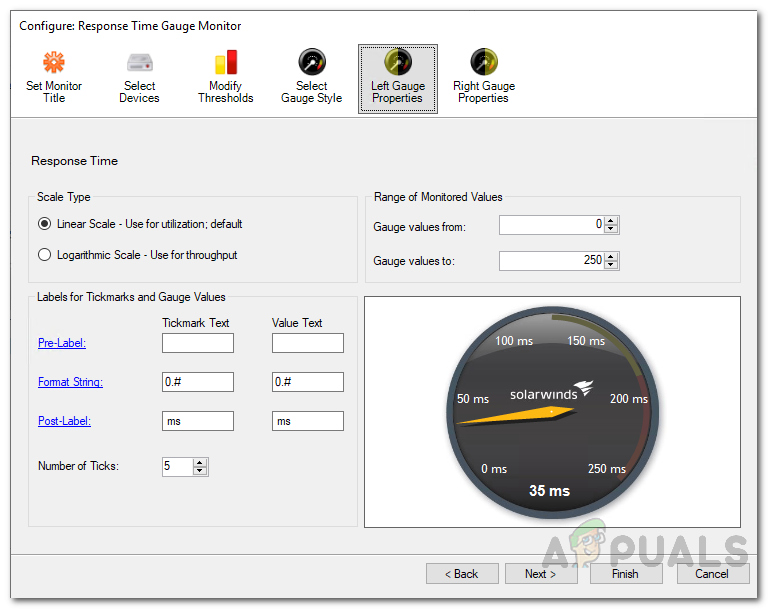
Gauge Properties - You can also change the gauge style if you do not like the default one. Other than that, you can modify the thresholds or change the title for the tool as instructed above.