How to Monitor Advanced Network Devices with SolarWinds?
Solarwinds Network Insight for advanced network devices like Cisco ASA, Palo Alto, and F5 is a combined feature of the Network Performance Monitor, NetFlow Traffic Analyzer, and Network Configuration Manager. This bundle gives the ability to monitor advanced devices like an expert.
Benefits of Solarwinds Network Insight
- Helps to ensure network service availability.
- Monitor the connectivity between the VPN tunnels.
- User sessions are connected to a VPN network.
- High Availability and failover monitoring.
- Policies configured on Palo Alto firewall.
- Monitoring relationships from service to traffic managers, virtual servers, pools, and pool members for F5.
- In-depth traffic analysis using NTA.
- Configuration management using NCM.
For the parameters mentioned above, we can set up alerts with thresholds we would like to get alerts whenever there is an issue. Also, we can create reports to review the historical data as well. That being said, let’s see how to use the feature.
To learn more about the features and download Solarwinds click on this link. During the installation process, select NPM, NCM, and NTA to install the Network Insight bundle to get a complete benefit.
Network Insight for Cisco ASA
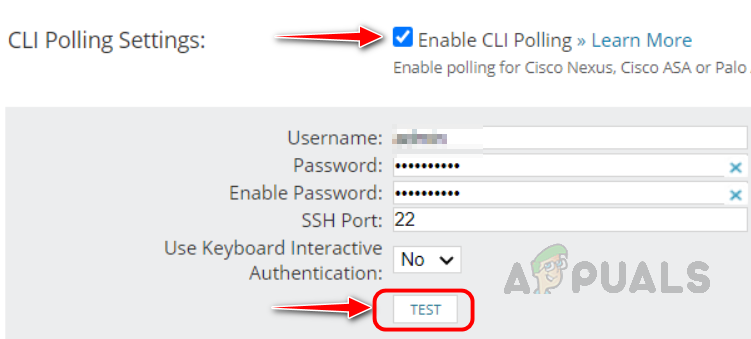
Solarwinds uses a combination of SNMP and CLI polling to monitor Cisco ASA. While adding the Cisco ASA to monitoring, we need to enable CLI Polling under CLI Polling Settings after configuring SNMP polling settings on the Change Properties page. Enter the CLI credentials used to login into the Cisco ASA device. Click on Test to validate the credentials. We can monitor additional Cisco ASA-specific details by enabling CLI polling.
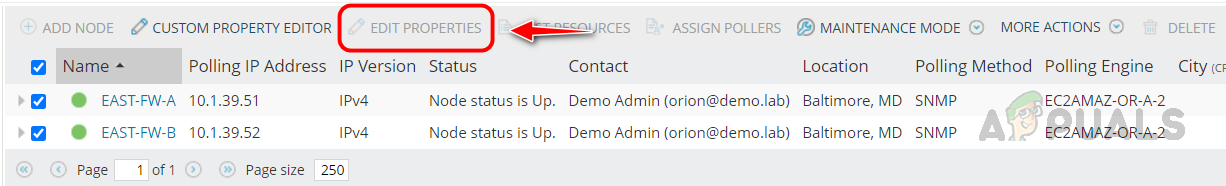
To enable CLI polling for already monitored Cisco ASA devices, select the devices you want to enable CLI polling in the Manage Nodes page and click on Edit Properties and follow the above step to enable CLI polling.
Let’s see how to check the monitored metrics for Cisco ASA.
- To check the metrics monitored for Cisco ASA, open any of your Cisco ASA nodes monitored in Solarwinds.
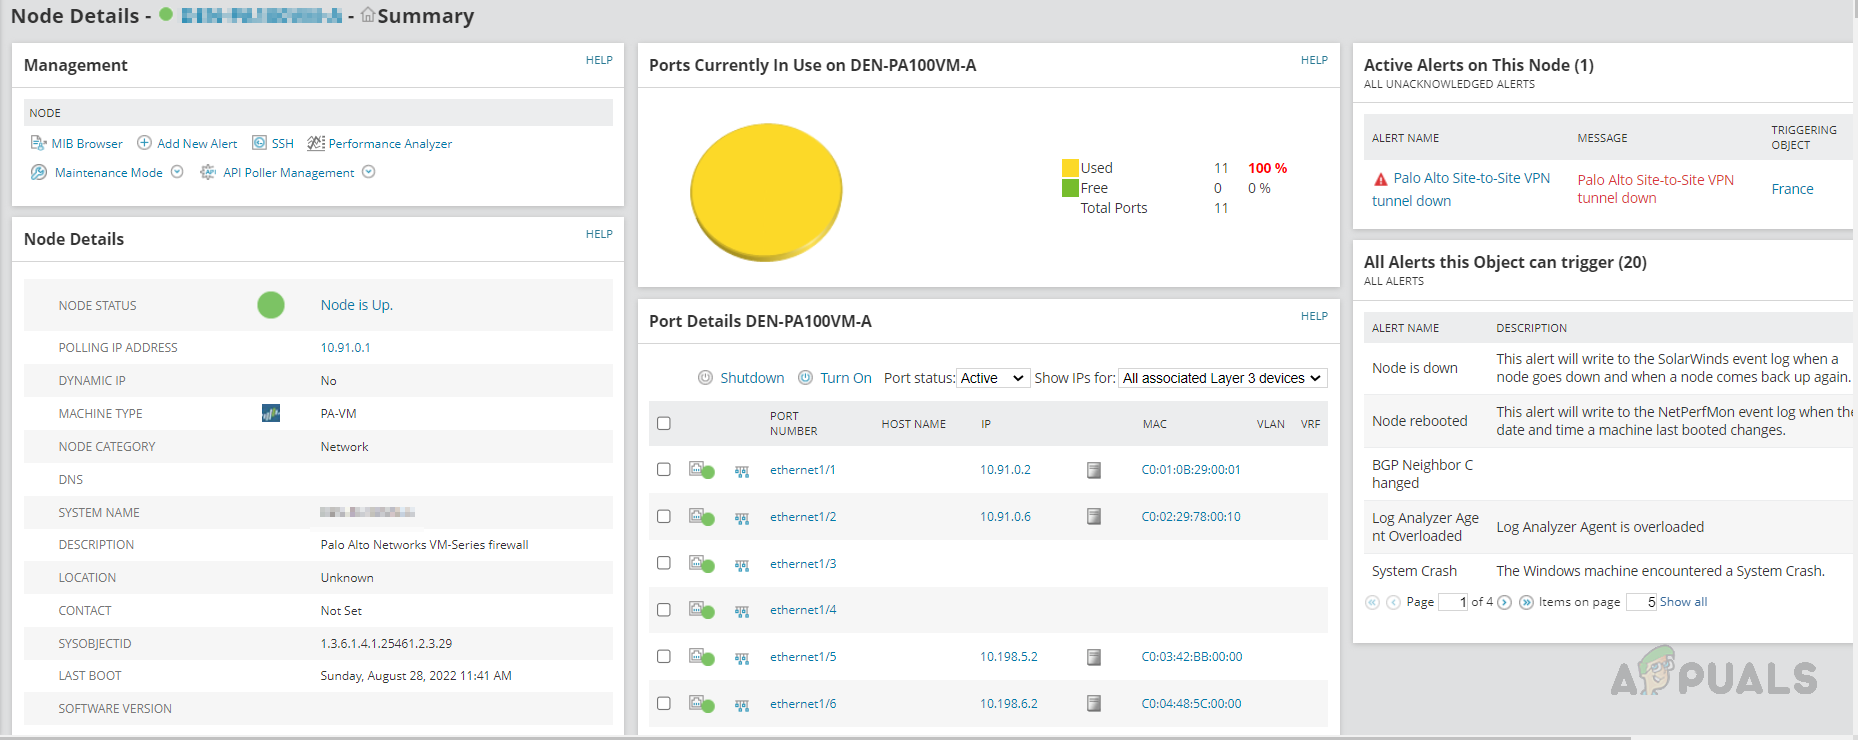
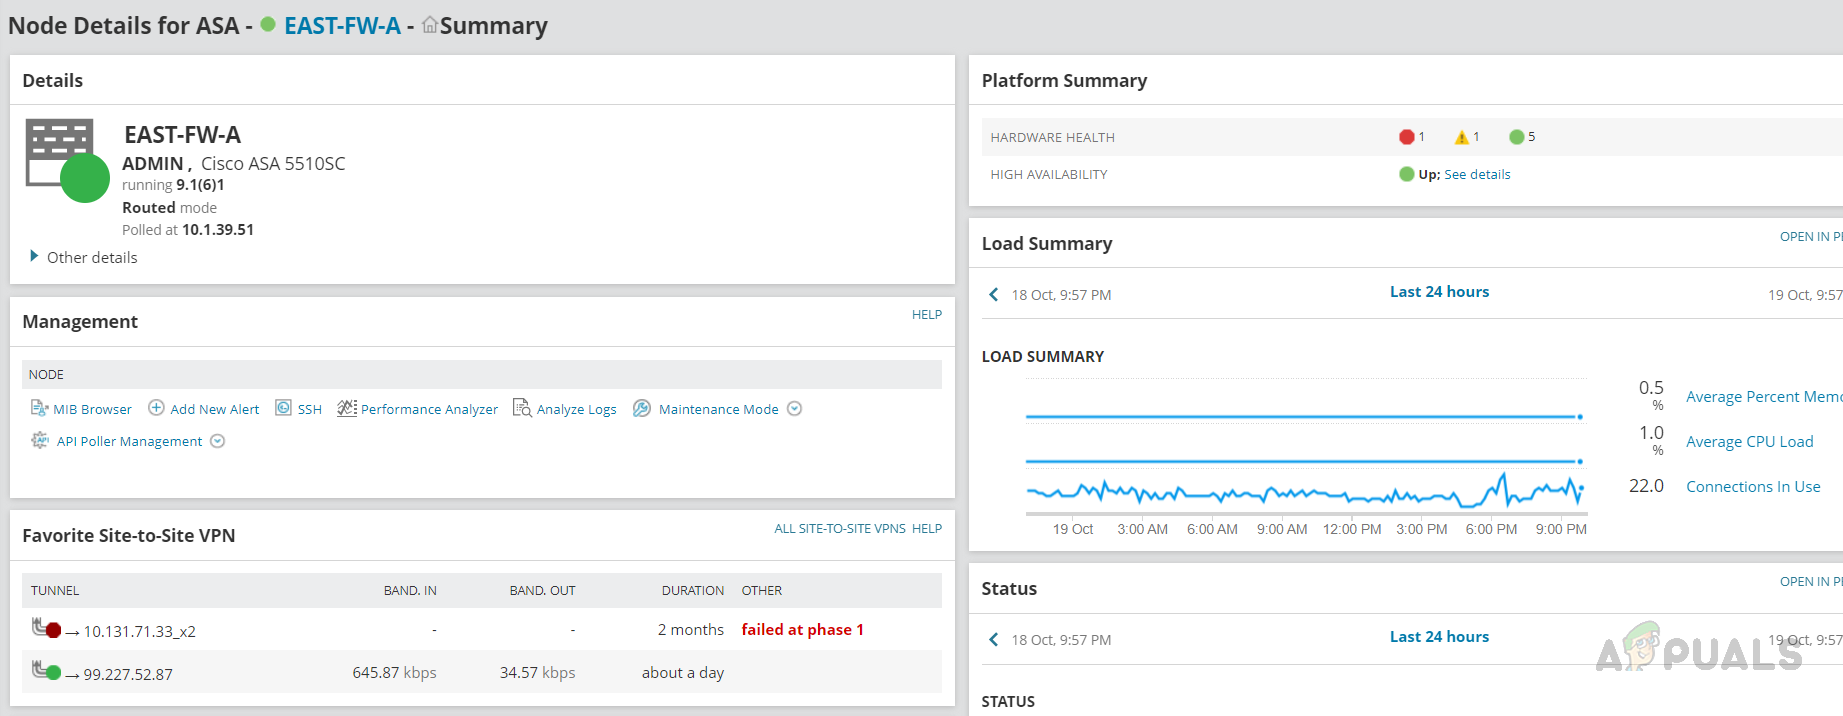 We can see the overall summary on the node summary page, like Node details, Load Summary, VPN Tunnel status, etc.
 - Use the left navigation pane to check any specific metric for Cisco ASA.
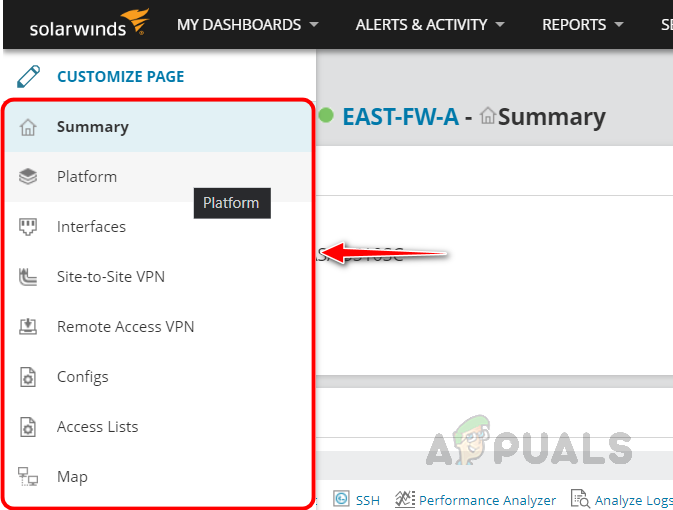
- Let’s check the details in each pane. Click on the Platform tab to check the details available on this page.
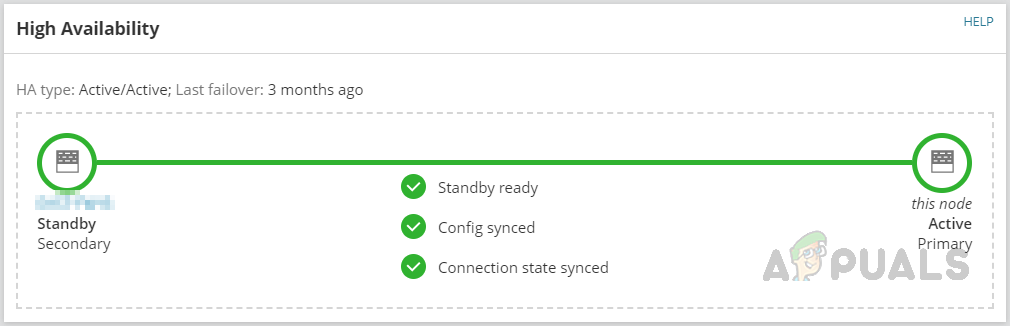
- Apart from node details, we can see the information about High Availability. Whether this device is primary or standby and config synced or not, and when the last failover happened.
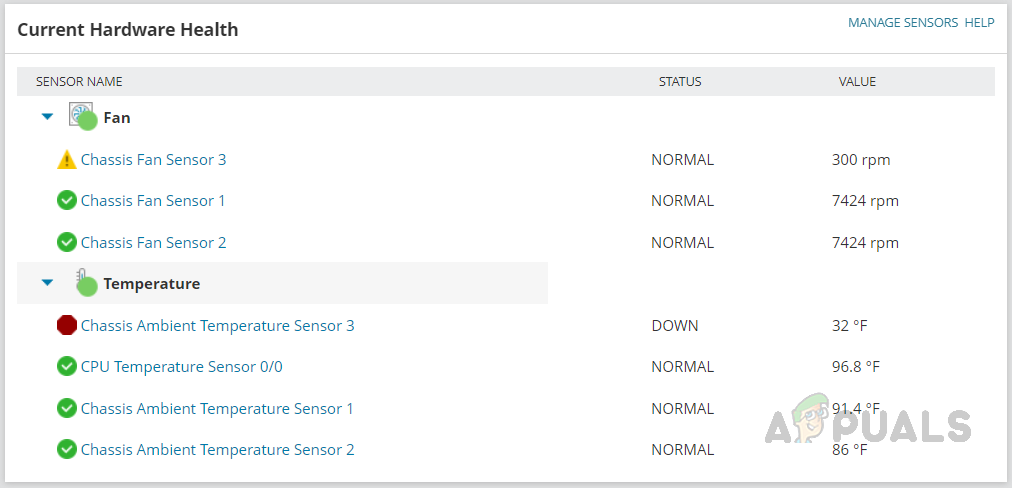
- Under Hardware Health, we can see the status and values of the hardware components available in the Cisco ASA device.
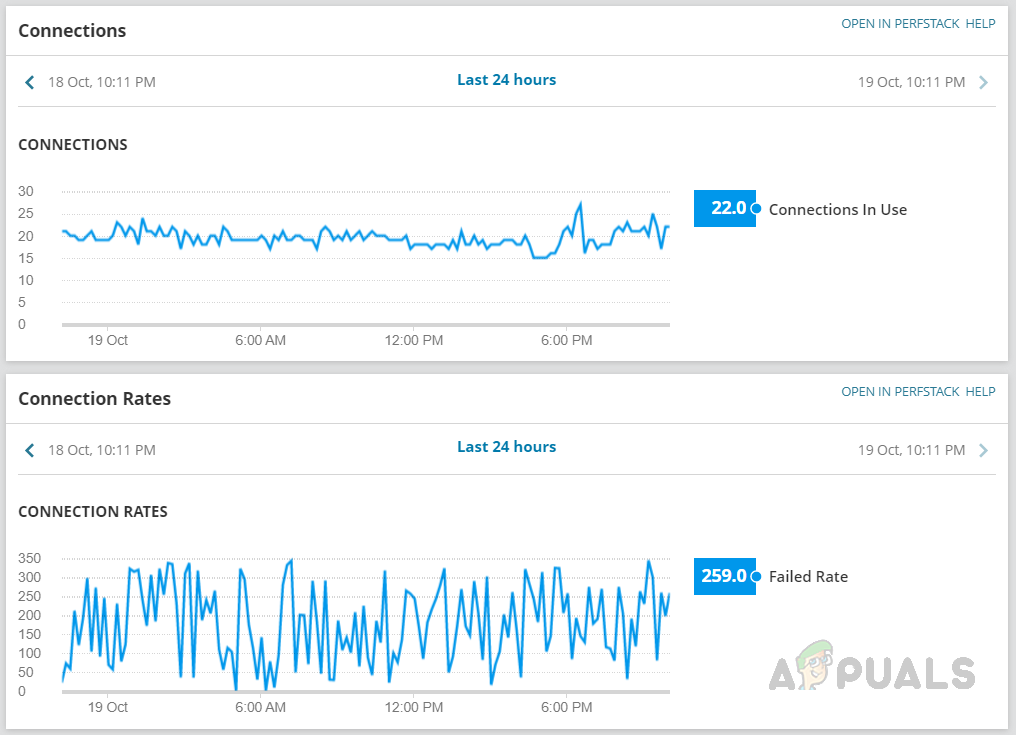
- We can monitor the VPN connections in use and connection rates in the Platform section.
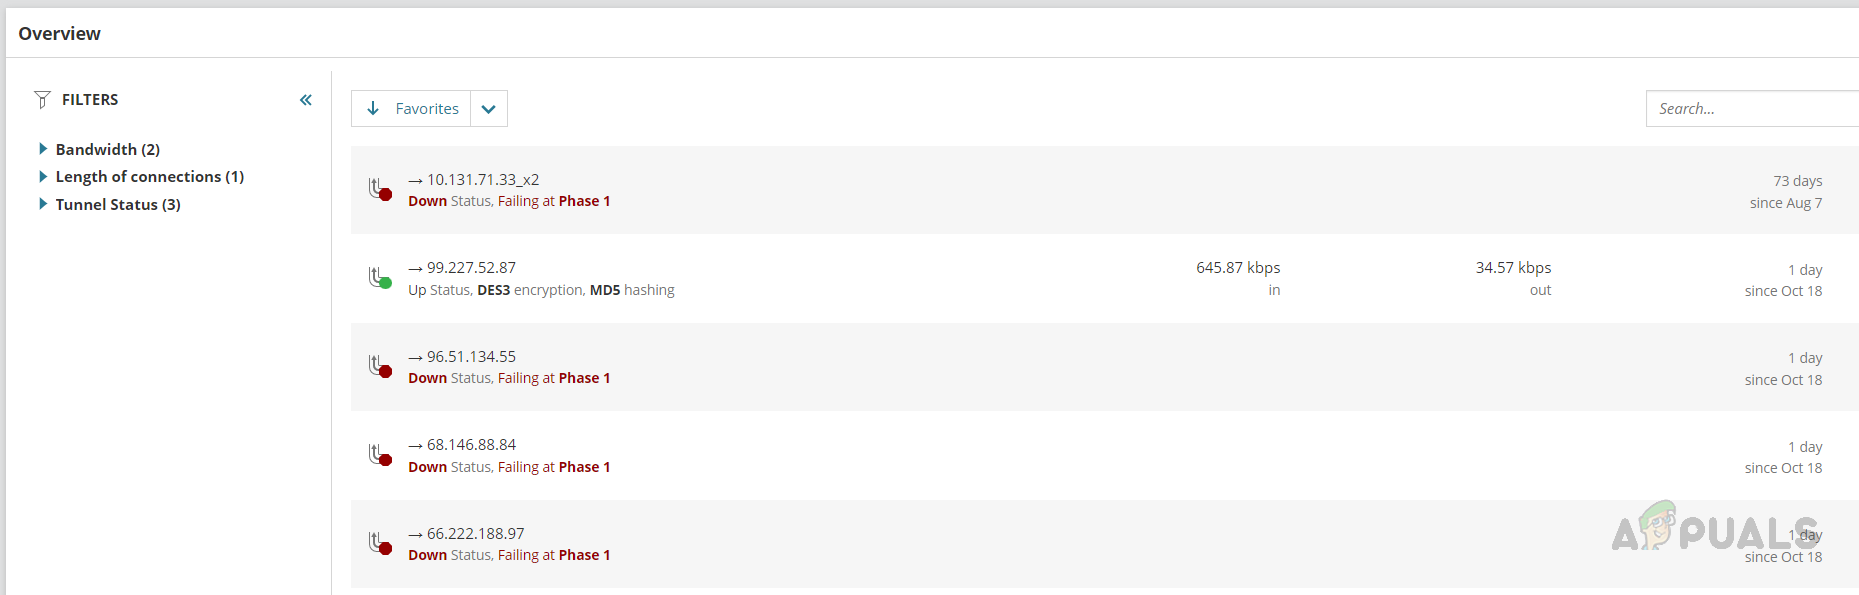
- Click on the Site-to-Site VPN tab from the left navigation pane to check the site-to-site VPN-related information. We can see the VPN tunnel status, speed, and if a tunnel was down when the tunnel went down. We can use the search box to check any specific VPN tunnel-related information.
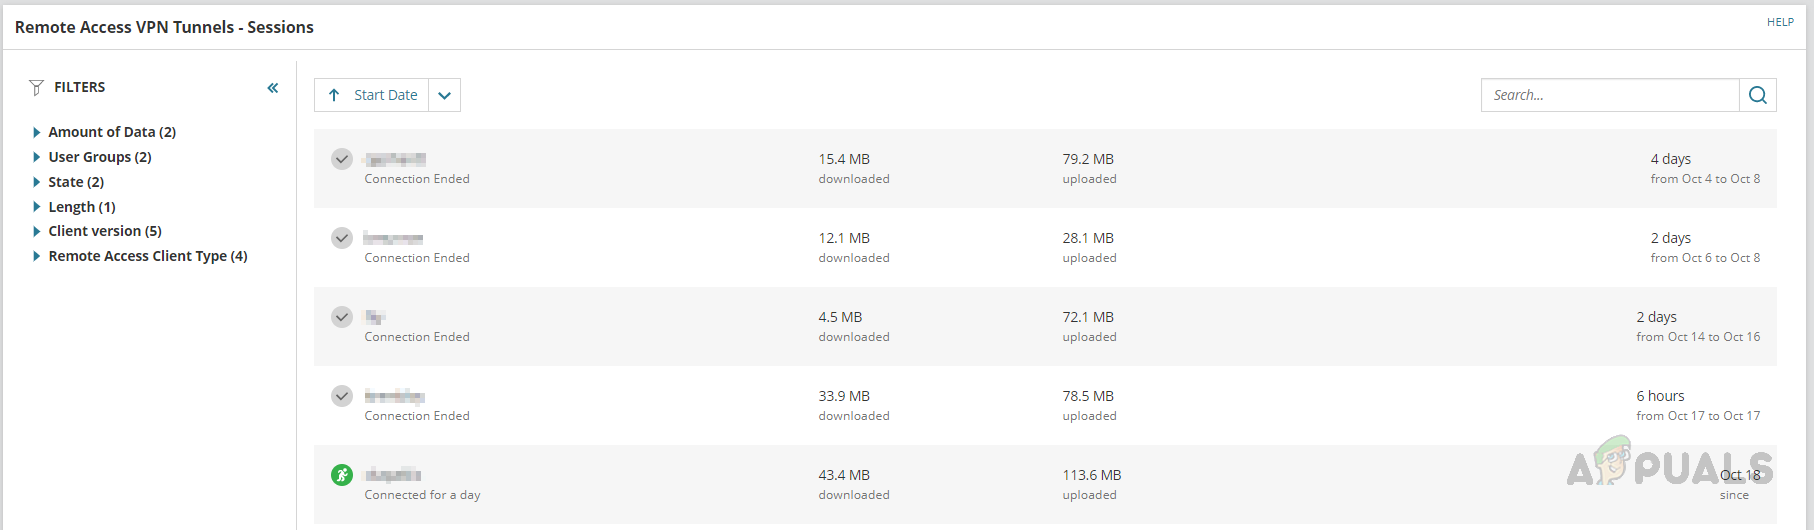
- In the Remote Access VPN tab, we can see the users connected to the VPN, duration, and usage details.
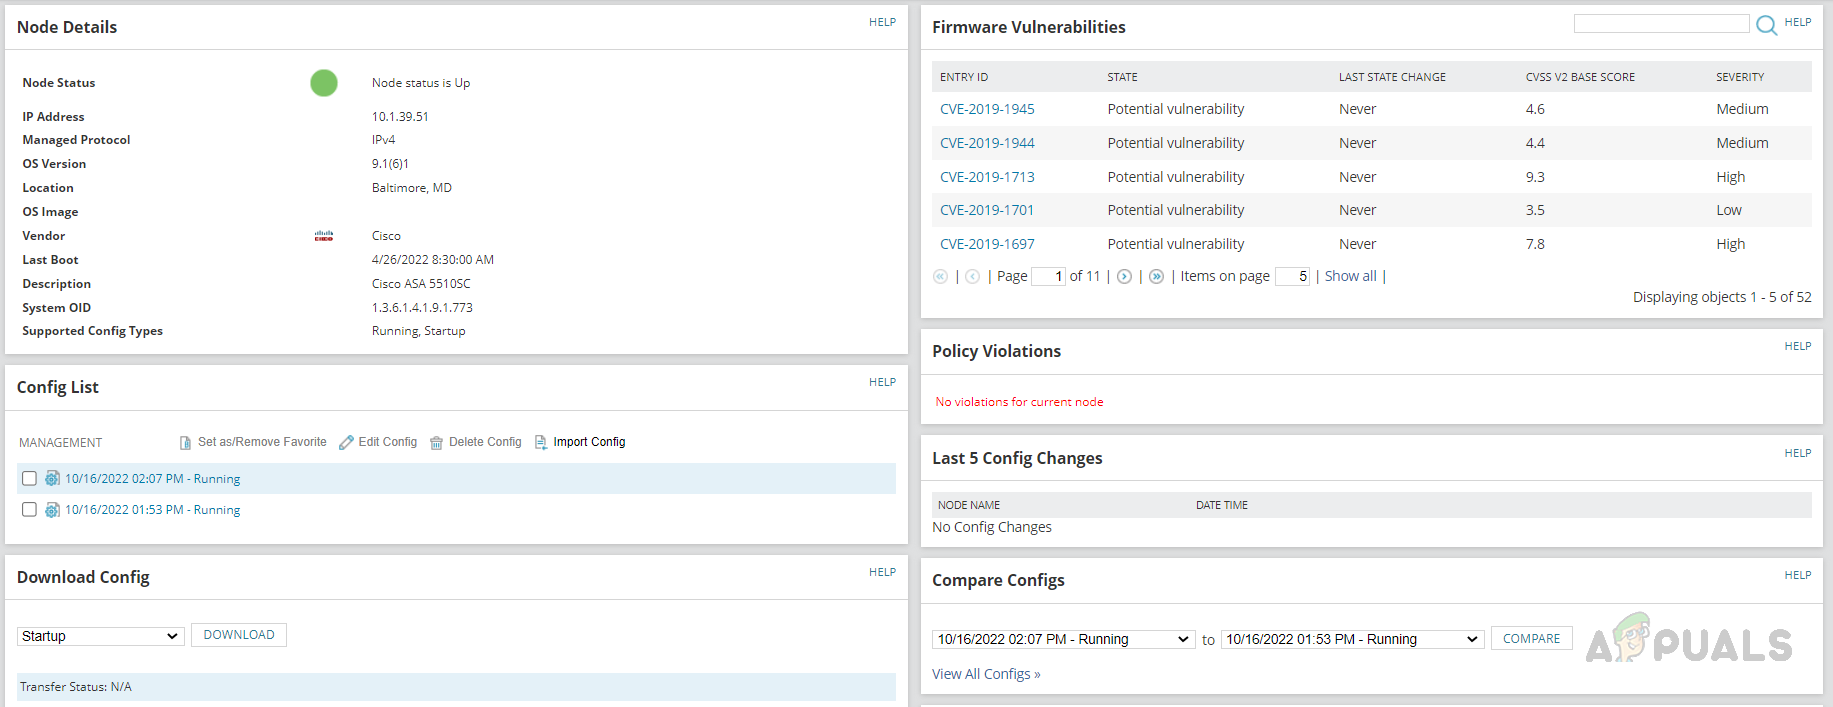
- On the Configs page, we can see the config-related information provided by Solarwinds NCM, like when the last config backup is done, vulnerability-related data, policy violations, and more.
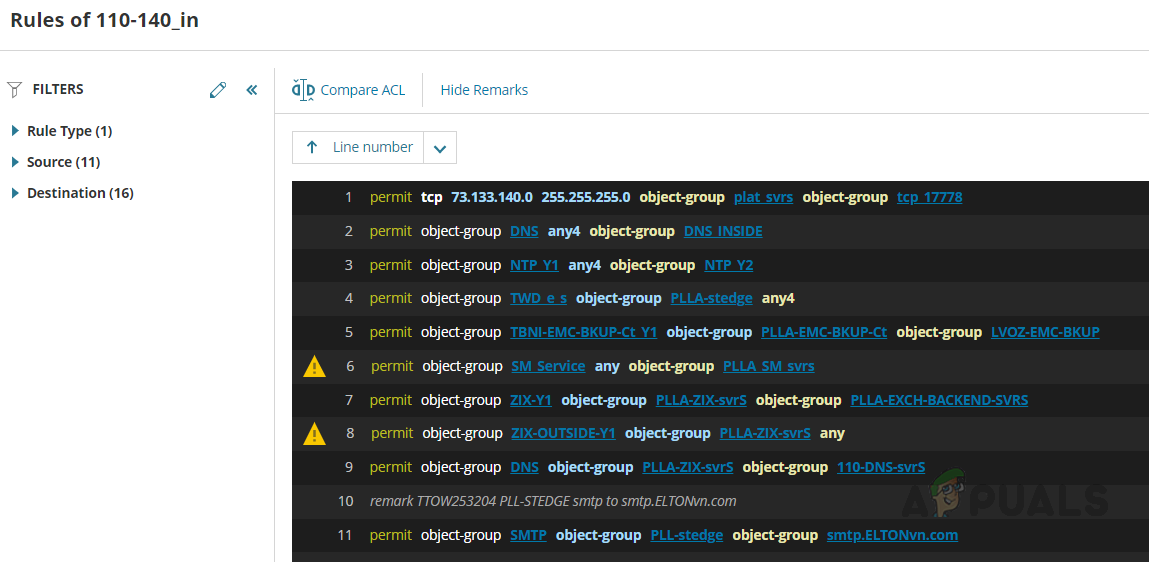
- We can view the applied ACLs on the Cisco ASA device on the Access List page.
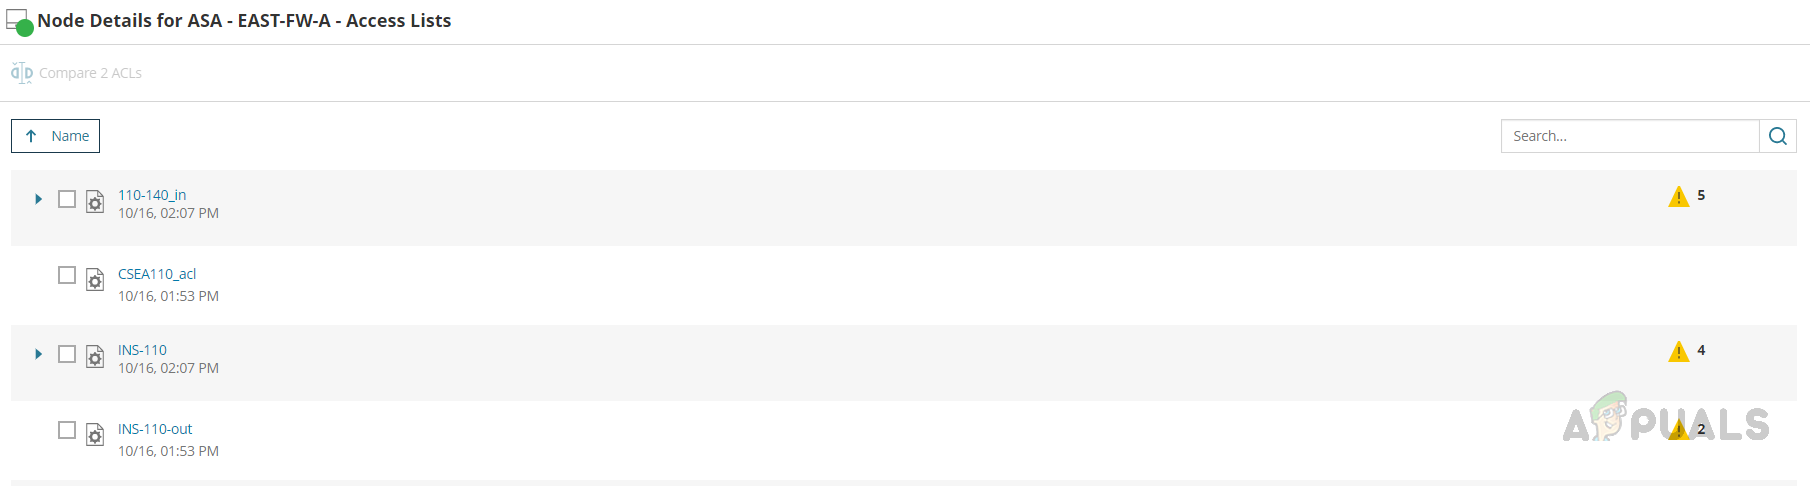
If you click on any of the rules, the rules page will open, and we can validate the applied rules.
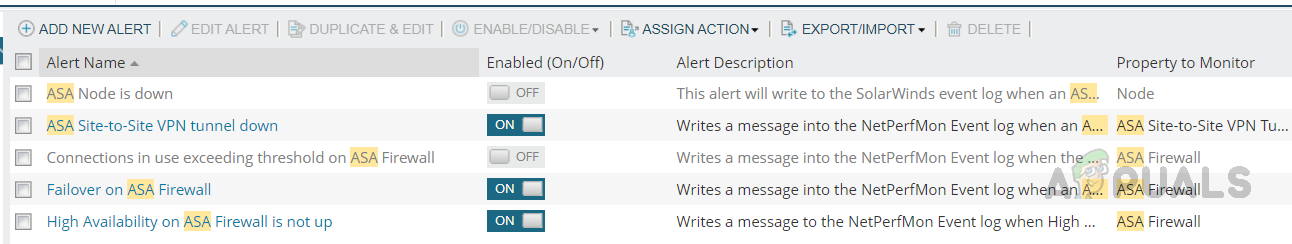
 With the help of Solarwinds Network Insight, we can monitor all these parameters and configure alerts to notify us whenever any issue occurs. Also, we can create reports to collect historical data to review usage trends.
We can use the default alerts and reports available for Cisco ASA or customize the existing alerts based on our needs. Below are the default alerts available for Cisco ASA.
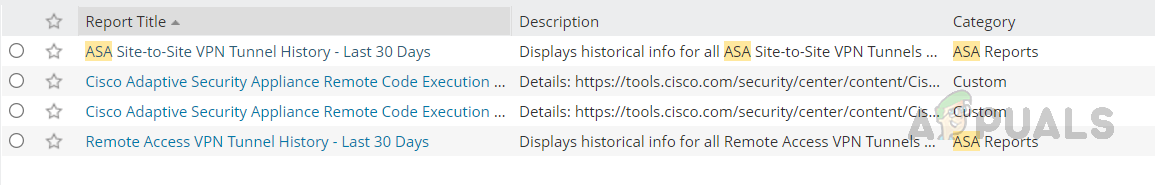
Below are the default reports available for Cisco ASA.
Network Insight for Palo Alto
Solarwinds has a dedicated poller for Palo Alto devices to collect data from the device. This poller uses REST APIs to collect the data. Hence we need valid credentials to poll the device through REST API. On the device’s Change Properties page, scroll down to Additional Monitoring Options and check Poll for Palo Alto and provide the credentials. Click Test to validate the credentials.
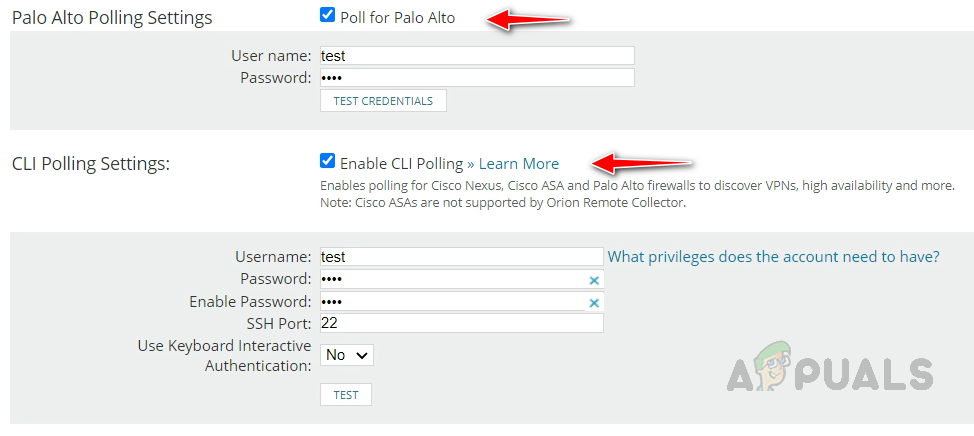
We can also enable CLI Polling for Palo Alto devices to get further details from the device. Once enabled the mentioned polling methods, we are good to collect adequate data from Palo Alto. Now, let’s see how to check the monitored data for Palo Alto devices.
- Open any of your monitored Palo Alto devices in Solarwinds. As usual, on the node summary page, we can see the overall summary for Palo Alto.
- On Palo Alto left navigation pane, we can see two different tabs than Cisco ASA. Global Protected VPN and Policies, all other tabs are the same as in Cisco ASA. Let’s check these new tabs.
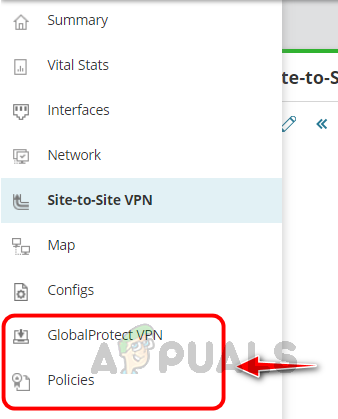
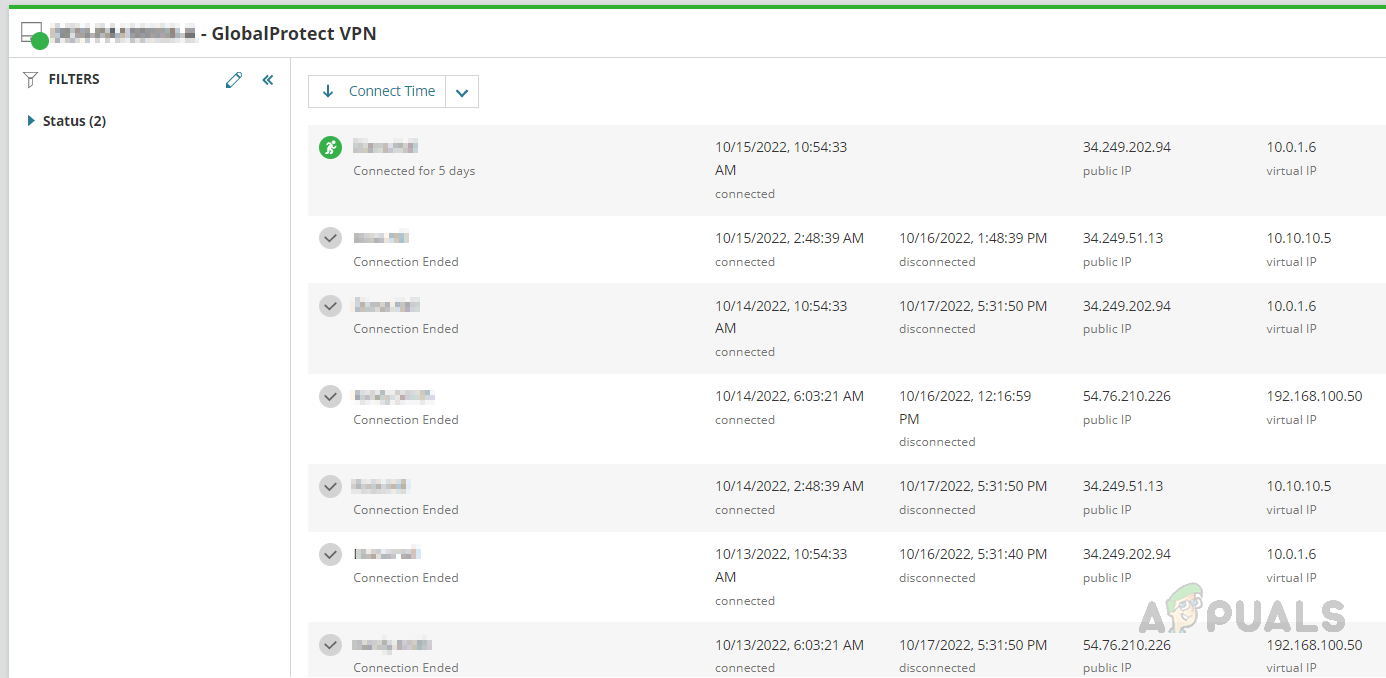
- Click on GlobalProtect VPN. We can see the user’s active and inactive sessions on the VPN, their usage, and other details.
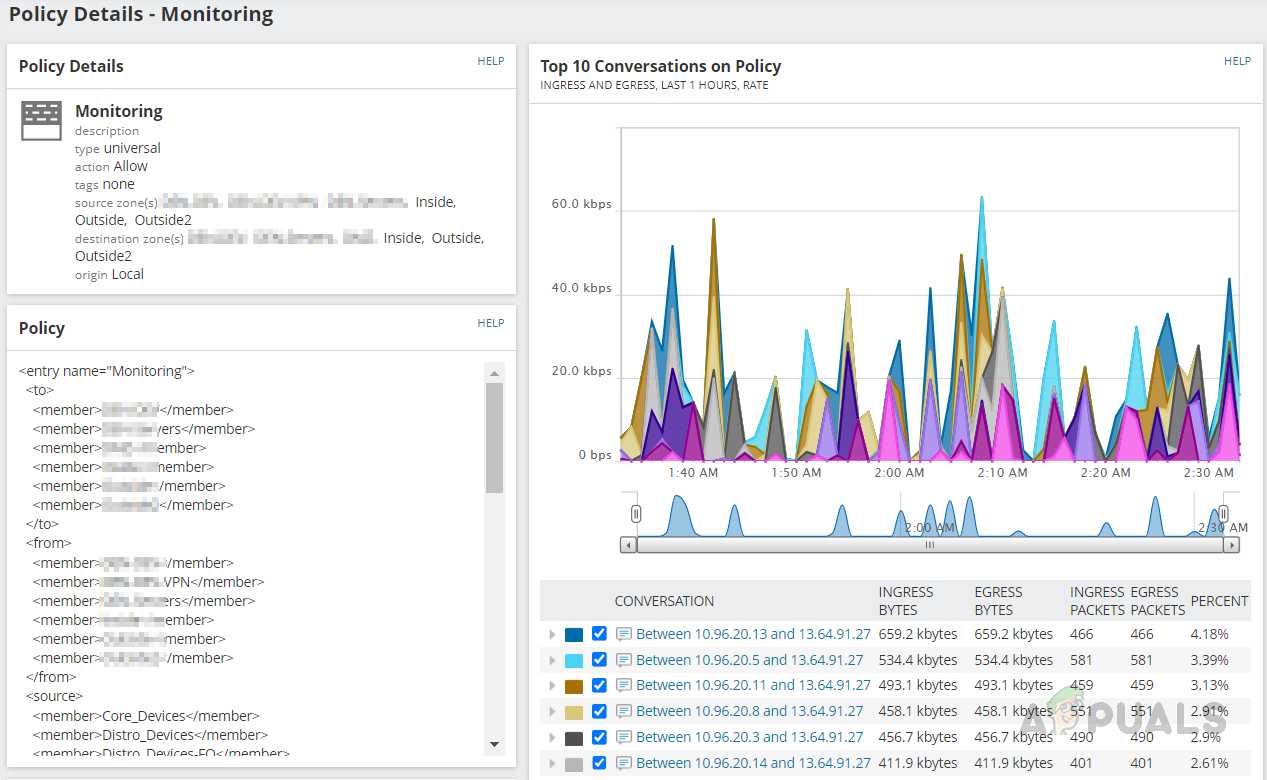
- On Policies, we can see the firewall policies configured on the device.
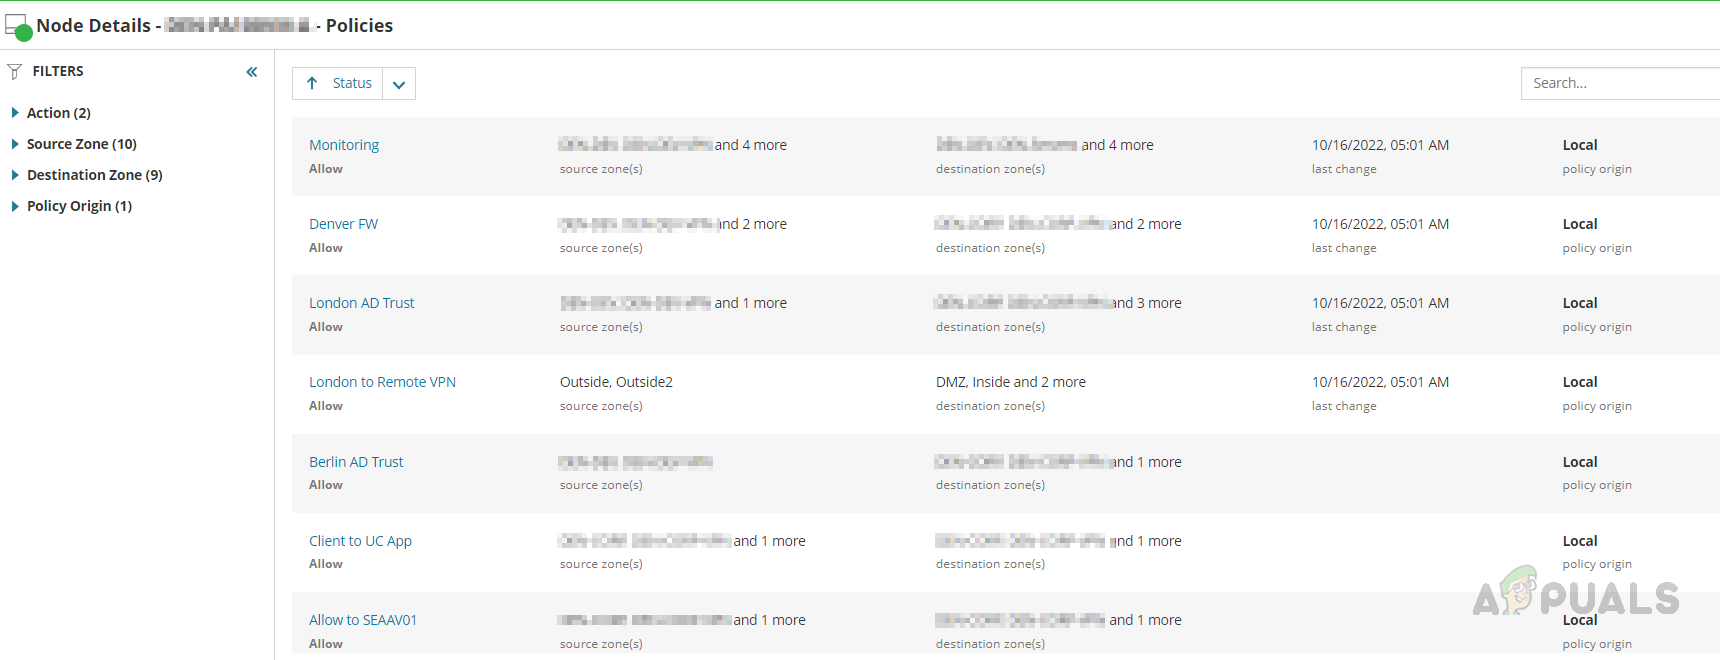
- We can review the policies by opening any of them.
Network Insight for F5 BIG-IP
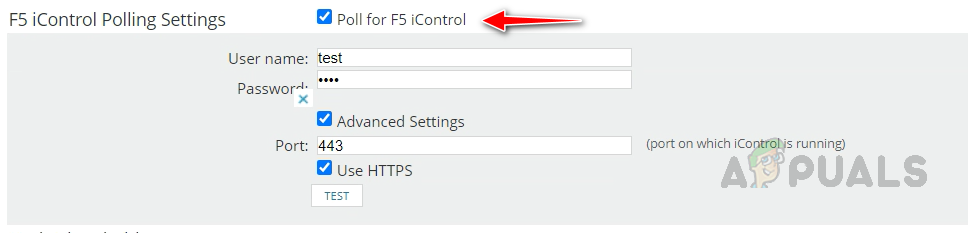
Solarwinds provides complete monitoring for F5 load balancers. SNMP collects most of the information for F5. We can enable the F5 iControl to collect health details for the pool members and to enable and disable the rotation of pool members. To enable F5 iControl, on the node’s change properties page, check Poll for F5 iControl and provide credentials. Credentials should have access to F5 APIs.
Let’s see how to check the monitored data on F5.
- We can see the usual information on the F5 device’s node details page.
- If you go to the Network tab on the left navigation pane, we can see lots of information related to F5 BIG-IP.
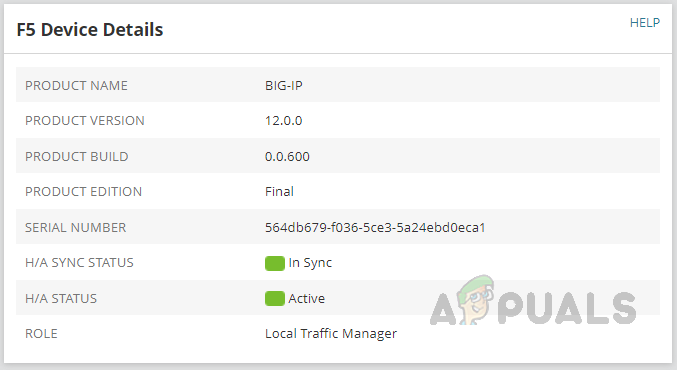
- We can see the device details and HA details.
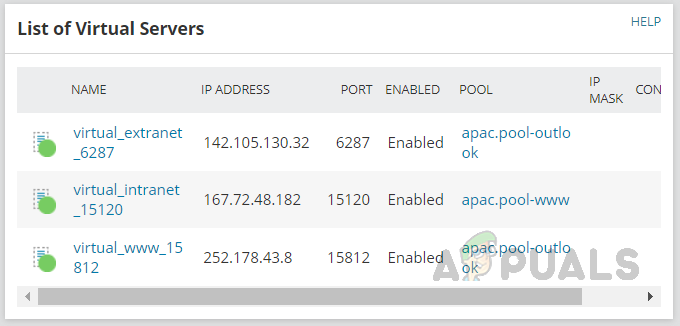
- List of Virtual Servers and their status.
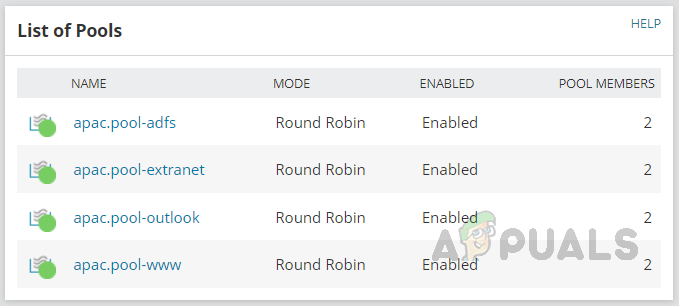
- List of Pools, status, and how members are in the pool.
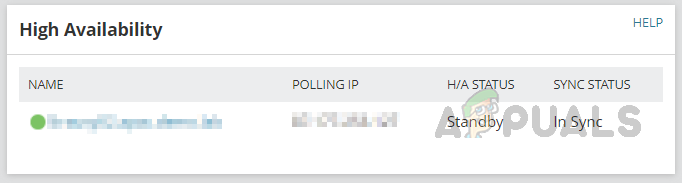
- HA server details and its sync status.
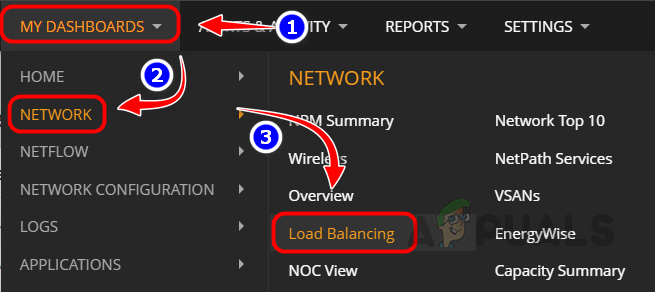
- To get more details about F5 BIG-IP, go to My Dashboards and click on Load Balancing in the Network sub-menu.
- We can see the overall summary of the load-balancing environment.
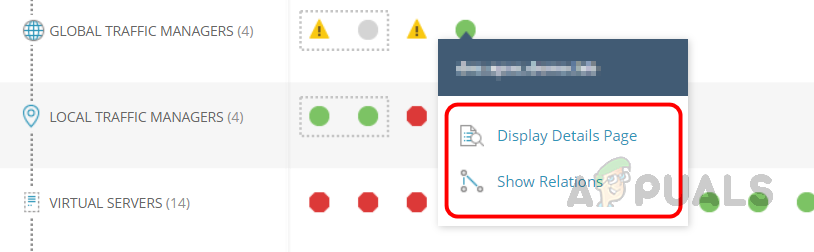
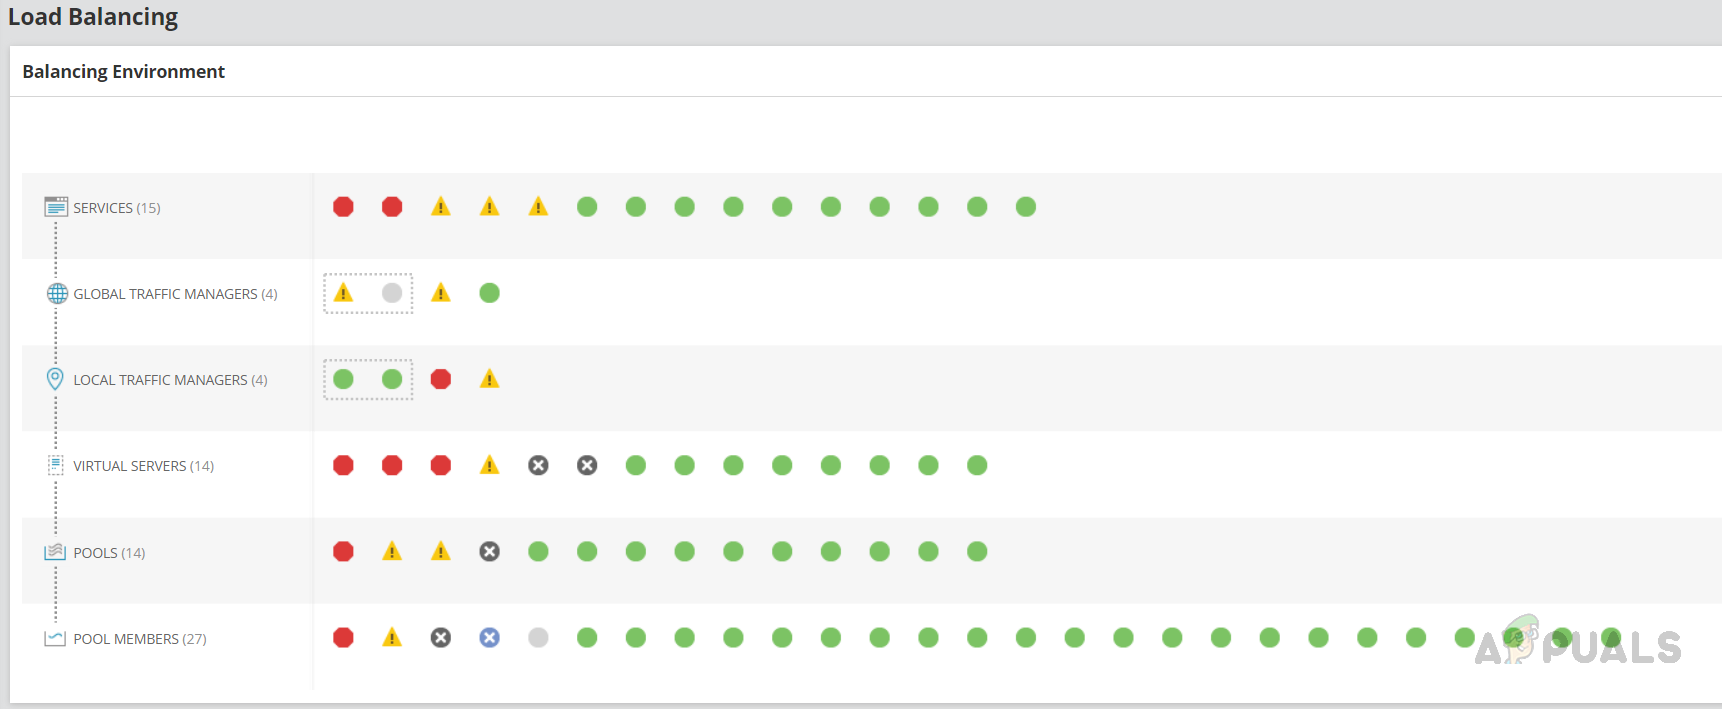 Current status of Services, Global Traffic Managers, Local Traffic Managers, Virtual Servers, Pools, and Poll Members. By clicking on each object, we can see the details about the object.
 - Let’s click on any object in the Global Traffic Managers and click on the Display Details Page to view the details about the GTM or Show Relations to check the relationship details.
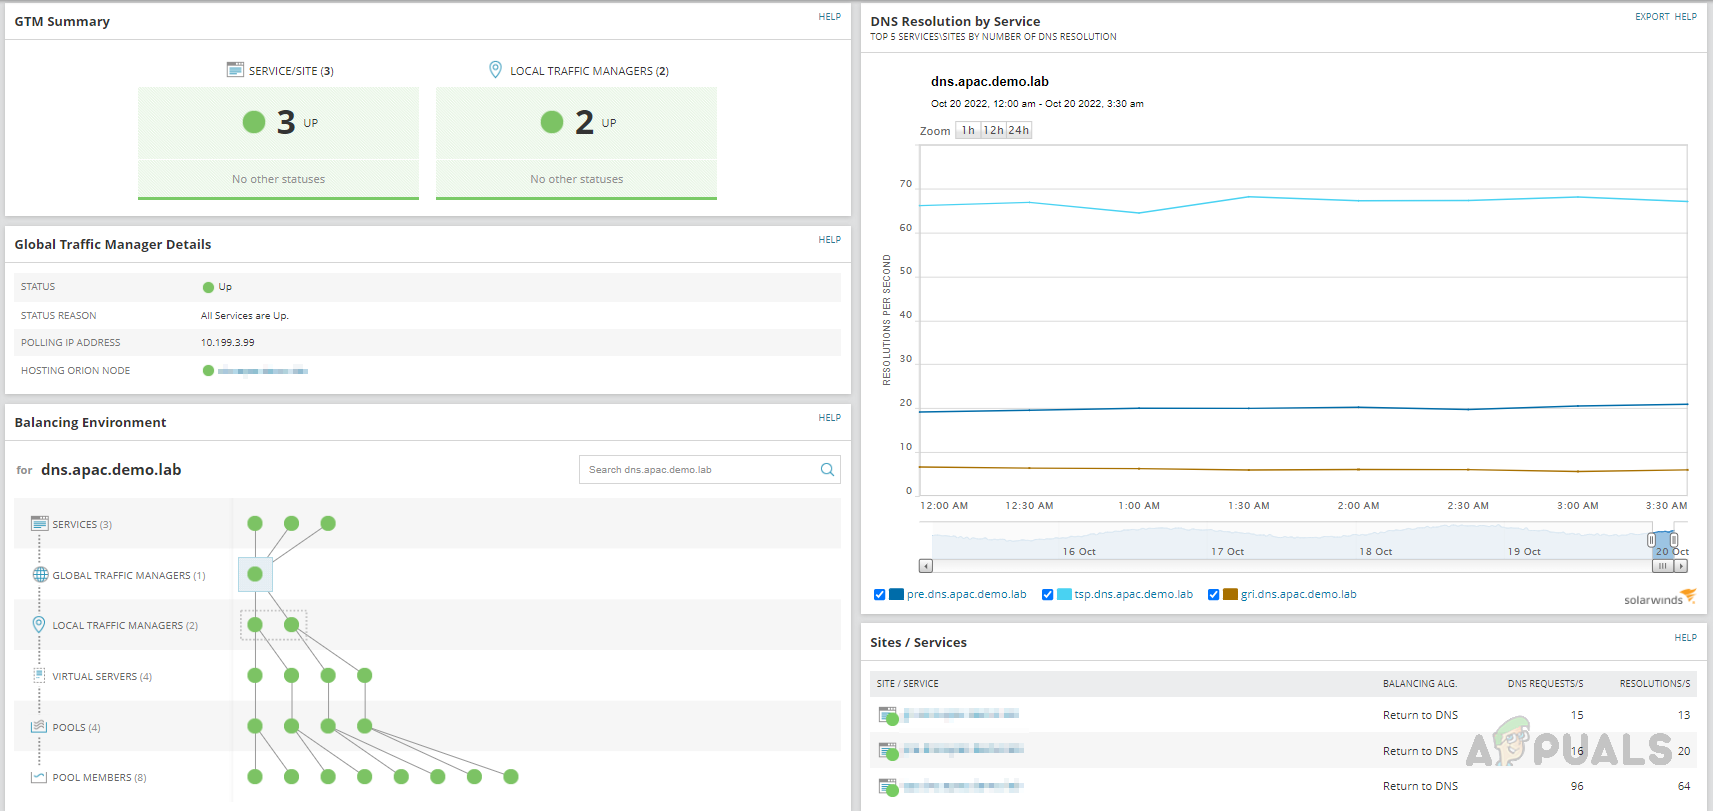
- On the details page, we can find all the details about the GTM.
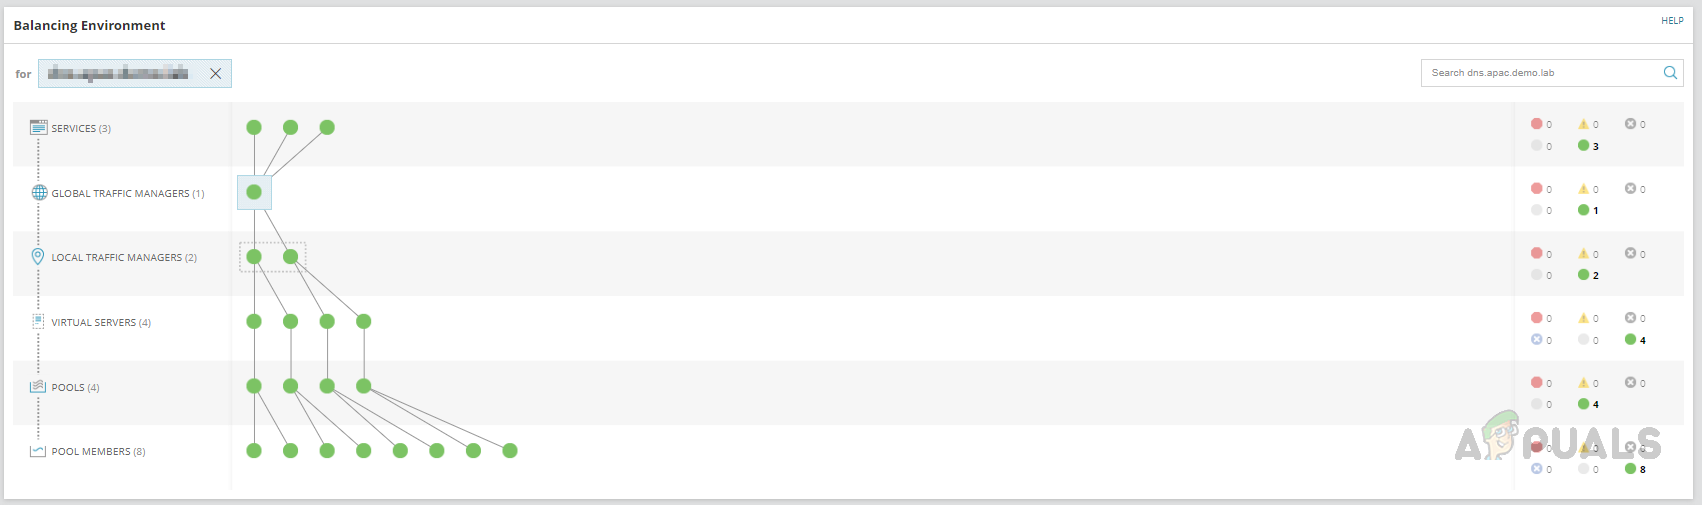
- On the relations page, we can see the relationship details for the GTM. By clicking on each object in the relationship, we can get more details about them.
This is how we can use the Network Insight feature available in Solarwinds to monitor the advanced network devices and the important parameters available on the device. Solarwinds also provides default alerts and reports for the parameters. Also, we can create custom alerts or reports for the parameters.