How to Use PerfStack to Troubleshoot Web Performance Related Issues?
When facing performance issues in an application, there can be various reasons, like CPU/Memory on the application server can be high or the network being slow on the connected interface, etc. So to troubleshoot the issue, we need to compare various data side by side. Comparing all these data in real-time in a single pane of glass can be challenging for System Administrators. Here comes Solarwinds to help System Administrators to ease and accelerate problem identification with its feature called PerfStack.
What is PerfStack?
PerfStack is a data correlation feature with most of the Solarwinds Orion modules. With PerfStack, we can correlate multiple data metrics side by side on a common timeline in a single pane. This can be shared with different teams; this gives the ability to collaborate with other functional teams.
Also, PerfStack data can be exported as raw data to better look at the data. Click on this link to learn more about PerfStack and download the product.
How to User PerfStack for Data Correlation
PerfStack comes with most of the Solarwinds Orion Modules. Below is the list of modules with the PerfStack feature.
Now let’s see how to use PerfStack for data correlation.
- Login into your Solarwinds web console.
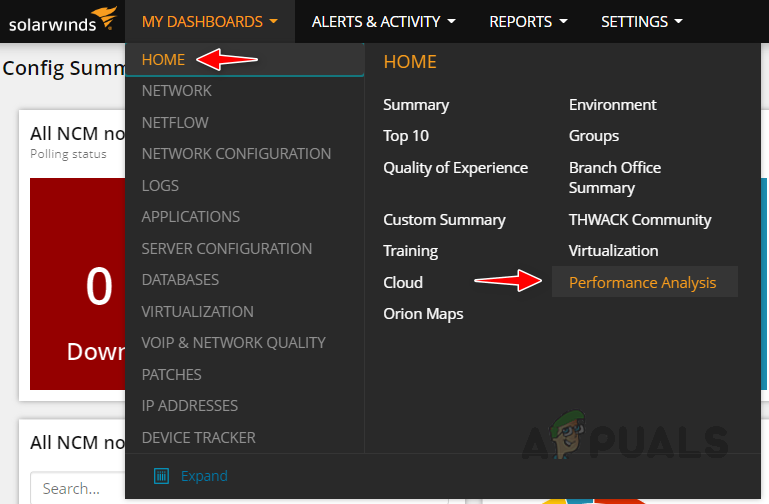
- Hover your mouse on My Dashboards and then Home. Now click on Performance Analysis from the Home sub-menu.
- Click on Add Entities to add the devices related to the issue.

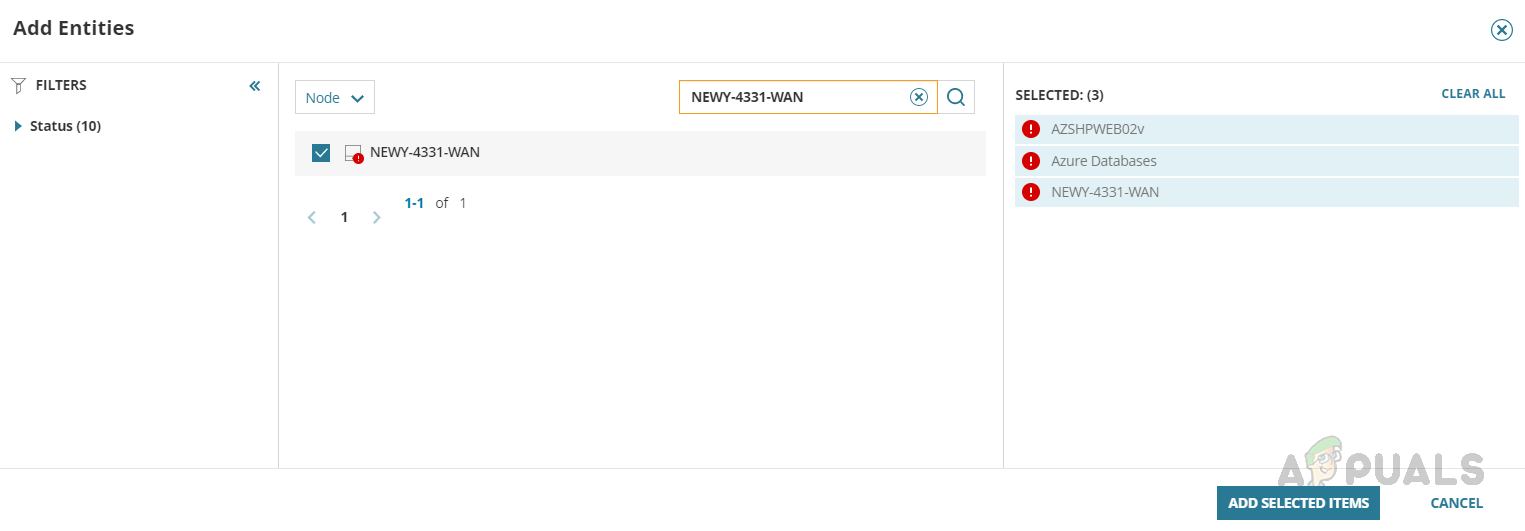
- Search device, select the device, and then click on submit to add the device into Metric Palette.
 You can search and select multiple devices to add to the Metric Palette.
 - Here I am adding three devices to the Metric Palette. My application server, database server, and network device connecting those devices.
- Now select the device to view the metric group related to that device.

- Expand the metric group and then drag and drop a metric into the analysis space. Here I am selecting Average CPU Load.

- You can drag-drop multiple metrics into the analysis space; you can drop different metrics on the same metric graph you already dropped. Here, for example, I am also dropping the Average Percent Memory Used metric on the Average CPU Load graph.
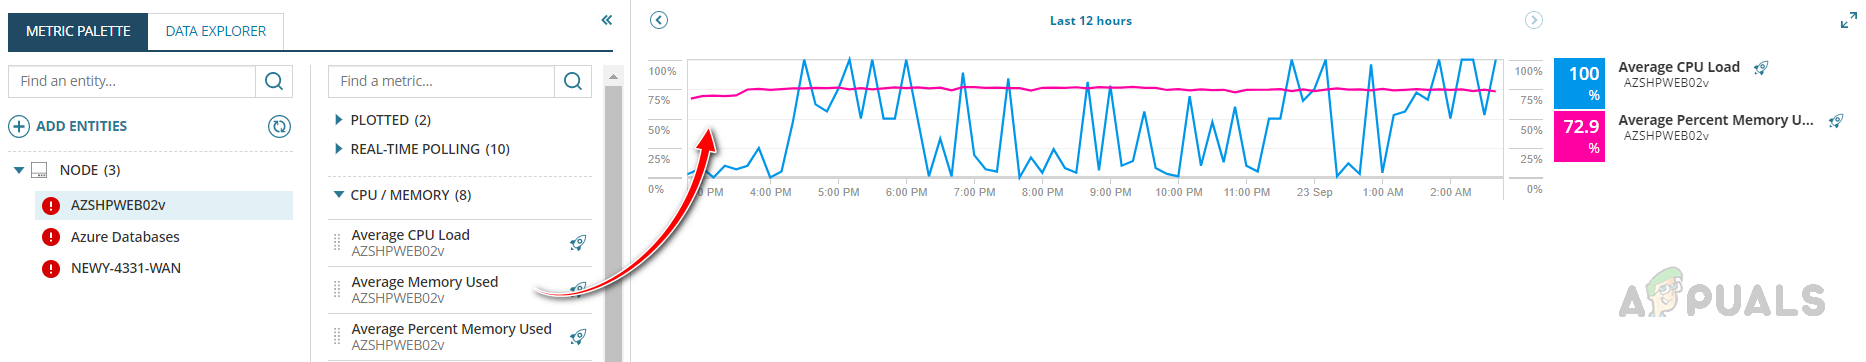
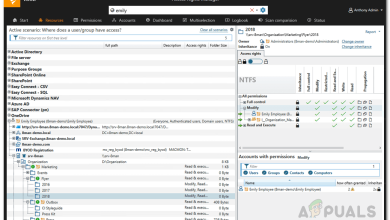
If we drop different metrics on the same graph, they will be differentiated with different colors. - In this example, I select CPU, Memory, and Response Time to correlate the data between those metrics to identify any abnormalities.
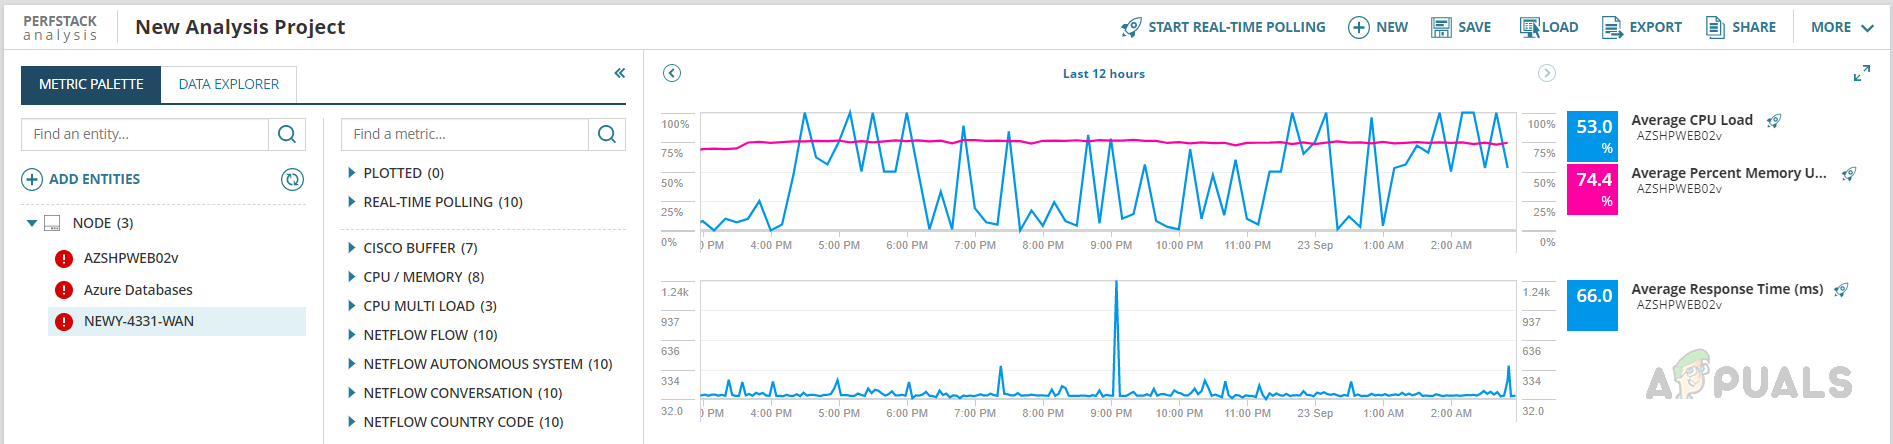 Now I can compare these data for abnormalities. In this example, memory utilization on the server is consistently above 70%. But this is not only a reason for the performance issue.
 - Now let’s include metrics from the related devices to identify the cause.
- To add additional entities related to the device, click on the icon below.
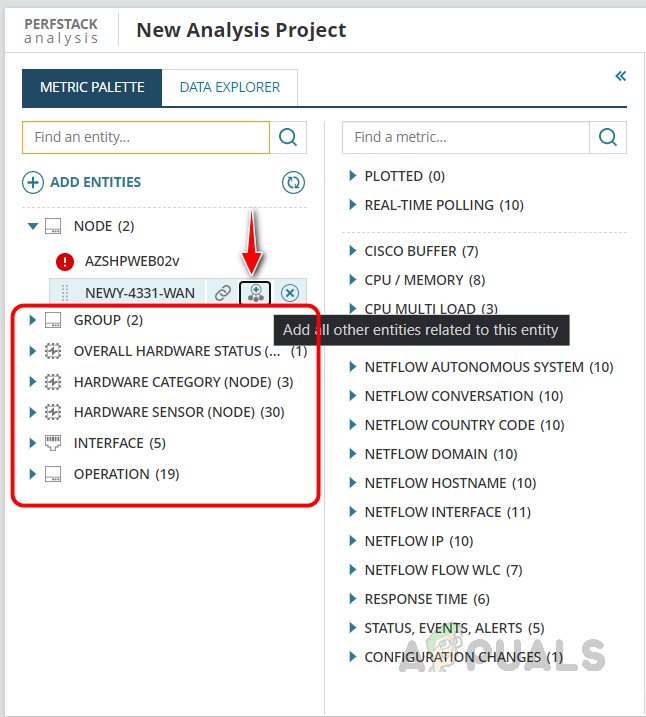
This will add other entities like interface, hardware sensors, etc. We can expand the entity group and select an entity to get the metrics related to that entity. - In this example, I have selected the Interface entity and selected an interface; now, I can see all metric groups related to that entity.
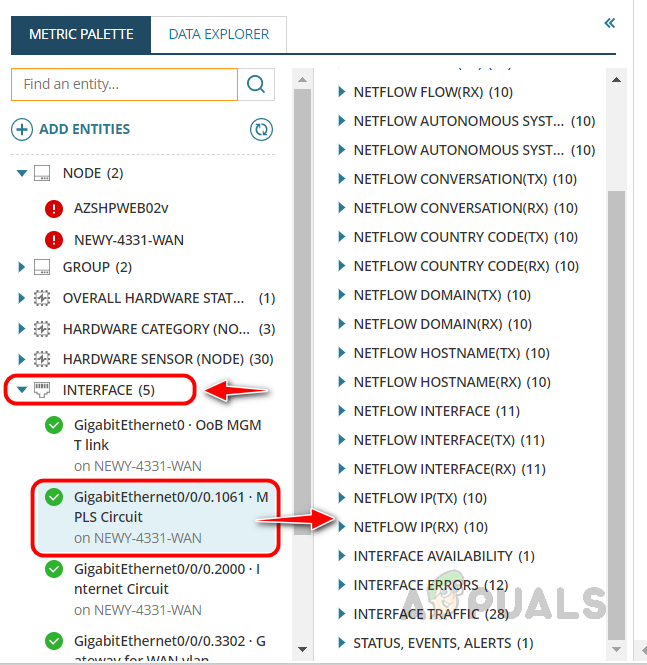
- We can drag and drop the metrics in the analysis space for further analysis.
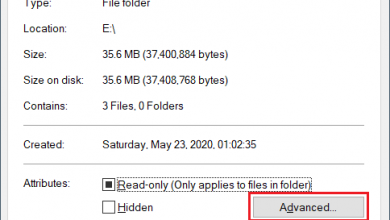
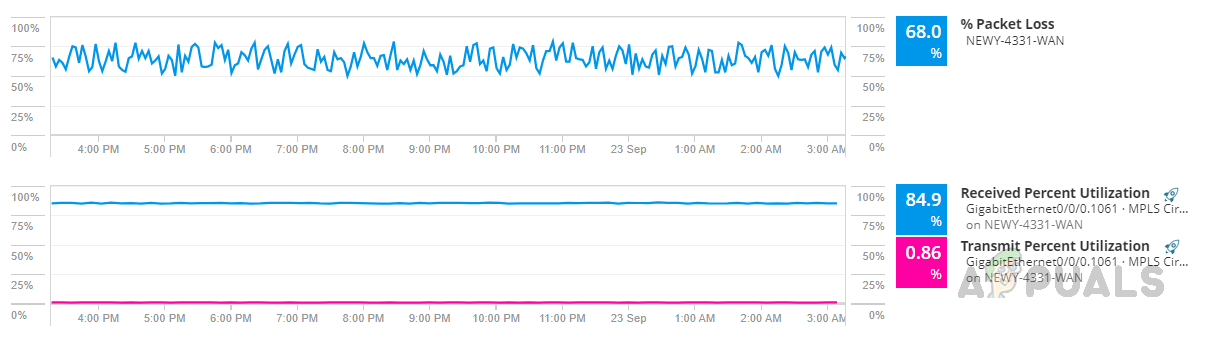 I have included packet loss and interface transmit and receive metrics for comparison.
 - From this graph, we can see there is a huge packet loss on this device, and also received percent utilization is high. These two factors can be a reason for my performance issue in the application.
- Now we have to work with the Network team to fix the packet loss issue on this device and the high bandwidth utilization.
- Packet loss issues can be fixed with the help of the service provider.
- We can use Netflow Traffic Analyzer to fix high bandwidth utilization to identify the cause and resolve the issue. If you are not aware of how to use Netflow Traffic Analyzer, click on this link.
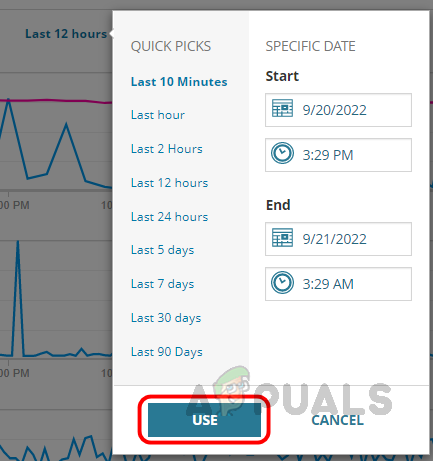
- If you want to see past data for an issue that already happened, we can choose a custom time to analyze the data. To select a custom time, click on the Last 12 hours.

- Now select the pre-defined or custom time frame and click on Use.
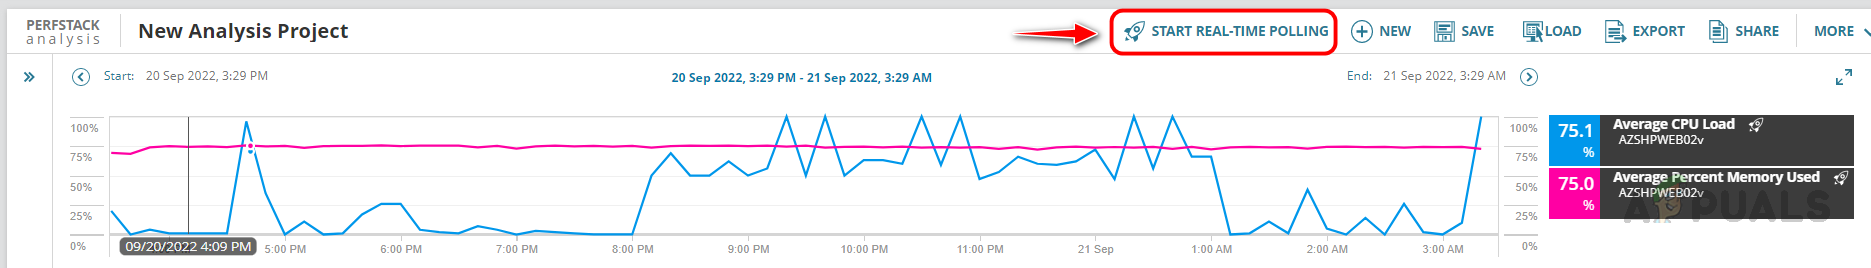
- Now I can see the data for the custom time range I have chosen.

- If you have an issue in real-time and want to see the real-time data for correlation, click on Start Real-Time Polling.
- Once start the real-time polling, you can see the real-time data from the device.
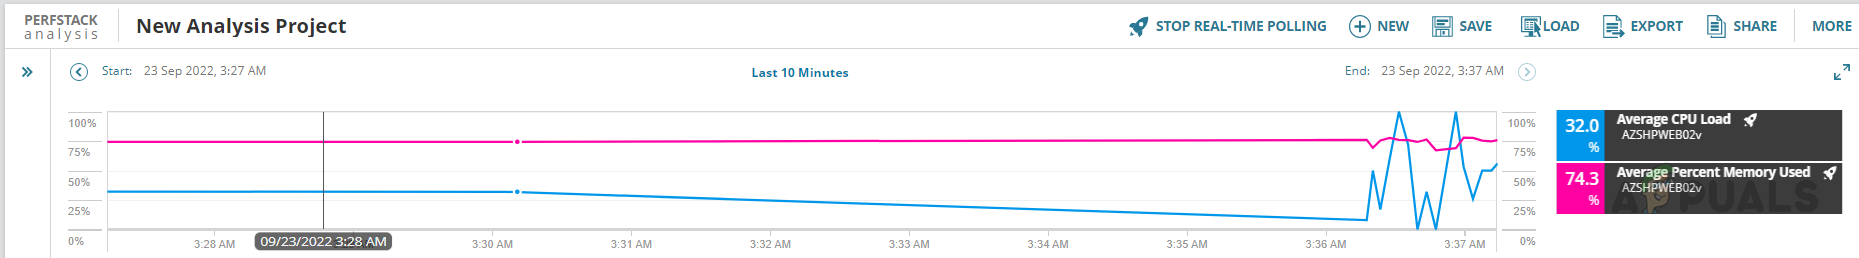
- To stop Real-Time polling, click on Stop Real-Time Polling. This will stop collecting real-time data.
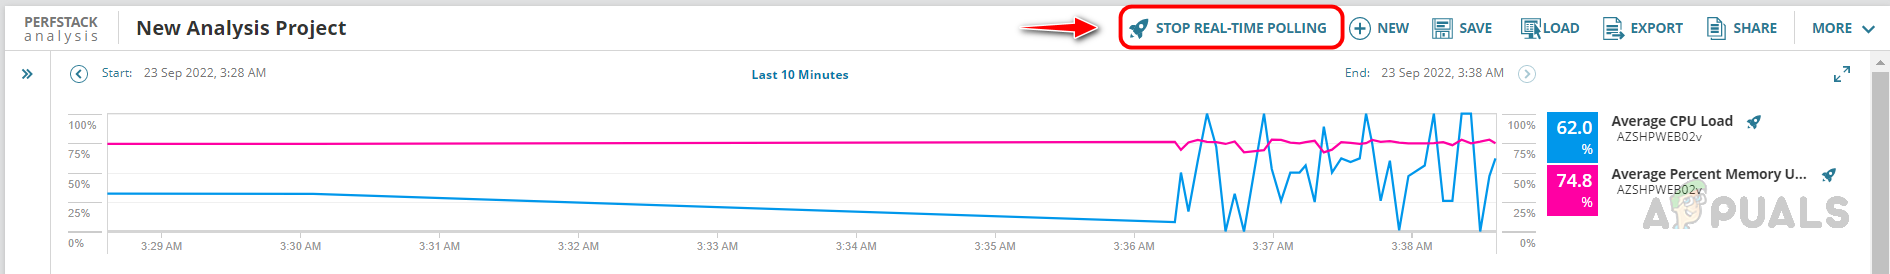
- We can save this PerfStack analysis for these devices to check in the future in case the issue reoccurs. Click on Save.
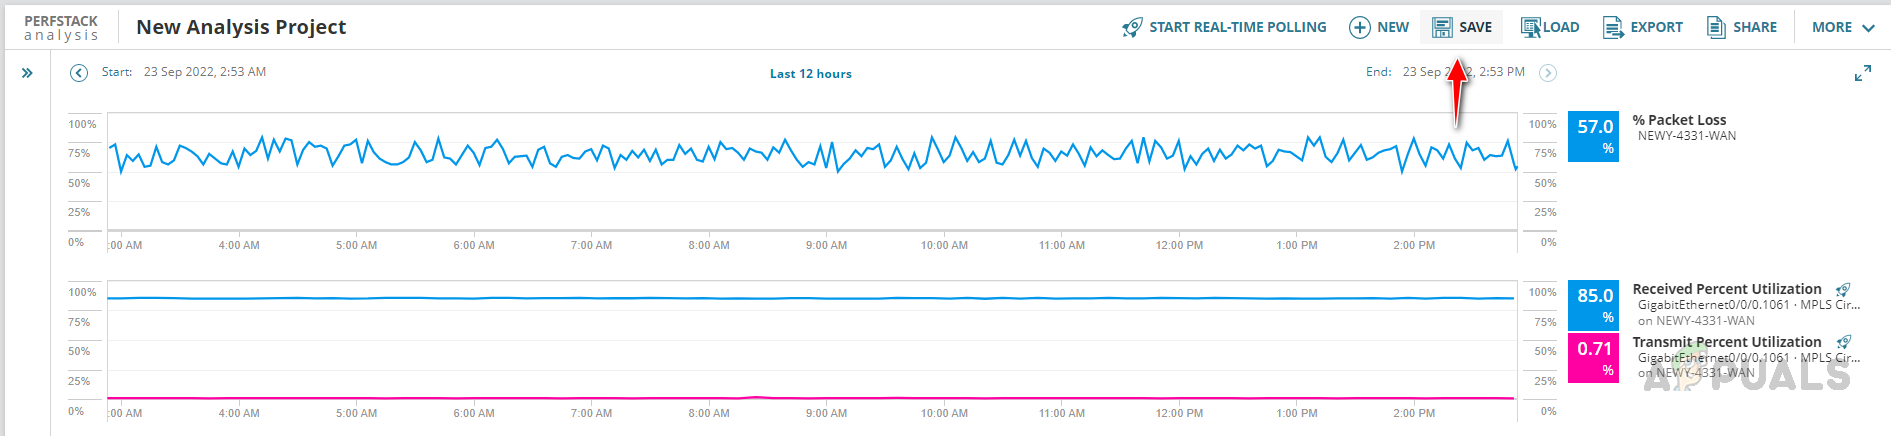
- Enter an appropriate name for this analysis project and click on Save.

- Your project will be saved in Solarwinds, and you can bookmark this URL and use it in the future. Also, you can add the URL to the Menu bar; we will discuss this in detail in a different article.
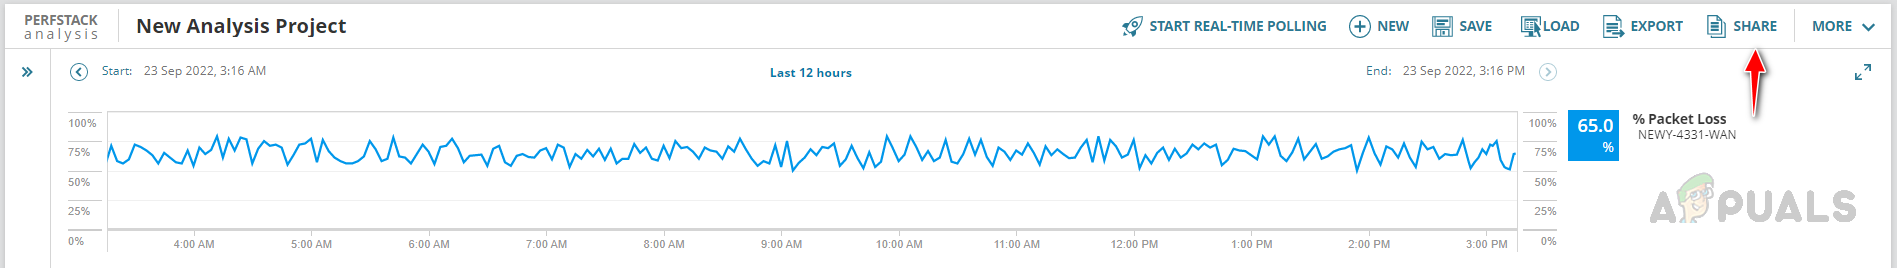
- We can share the project URL with other teams to collaborate with them for further troubleshooting; click on the Share to button, and the URL of the project will be copied, and we can share that URL with other teams.
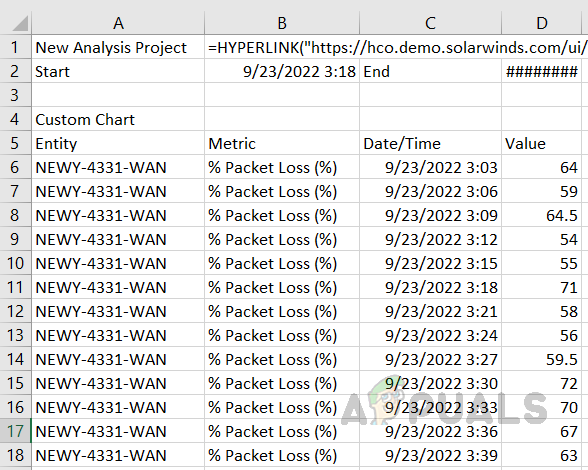
- We can export the raw data from these graphs by clicking on the Export option.
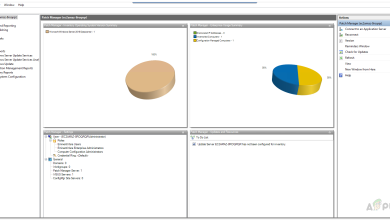
 Raw data will be exported in CSV file format; we can use the data to have a better look at the data for further troubleshooting. Here is the sample of raw data.
This is how we can use the PerfStack feature to identify the cause of a performance-related issue. If we have modules like NPM, NTA, SAM, and NCM in an integrated environment, we can use those metrics inside PerfStack to get further clarity on the issue.
This will help us drill down to identify the exact cause of the problem. Once we identify the reason, the issue can be fixed quickly. We can work on how to prevent and avoid the issue again by setting proactive alerts using Solarwinds advanced alerting feature.