How to Monitor Server Configuration using Server Configuration Monitor
We are all well aware of the importance of business networks. The competition is so vast that a small misconfiguration can lead to major impacts on your business. Users are now used to fast connectivity and if your servers are acting even a little bit slow, who knows, they might just start using other available platforms which is the last thing you want. Computer networks in the same sense have become rather complicated and with multiple servers running at a time, monitoring them could be difficult. One of the reasons your network might go down is the configuration errors that are produced on one of your servers. Since networks can run multiple servers at a time, finding the root cause of the error can consume a lot of time which results in greater downtimes and significantly impacts your reputation.
The question to ask here is, how can you monitor the configuration changes made to the servers? A server’s configuration can be altered anytime by one of the sysadmins and since a large network requires much more administrators, pinpointing the cause can be equal to finding a needle in a haystack. The answer here is to use the Server Configuration Monitor tool. Solarwinds, the company behind SCM (Server Configuration Monitor), is an American company that provides networking and system management services and also develops tools for the said purposes to help network and system admins. In this article, we will be showing you how to deploy the tool on your system and then provide step-by-step instructions to start monitoring your server configurations.
Installation of Server Configuration Monitor
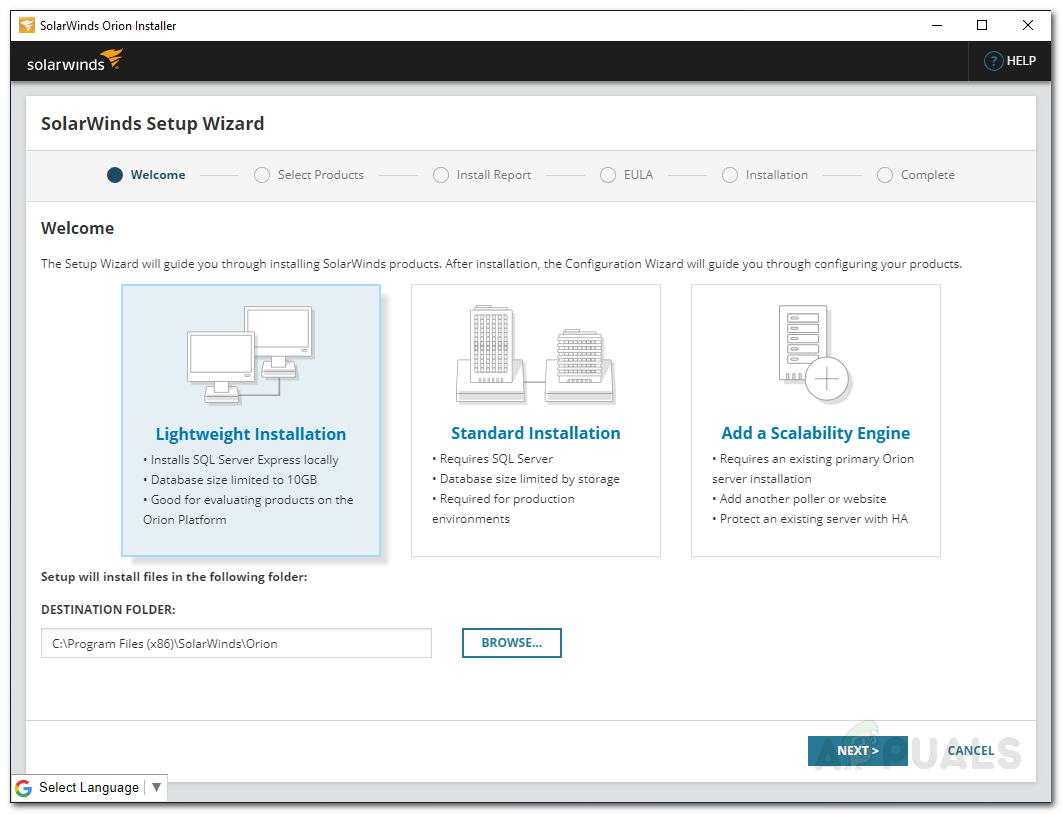
The installation part is really easy and simple as Solarwinds allows you to install the tool using Solarwinds Orion Installer. Orion is a suite of Solarwinds major network and system management tools like NPM, SCM, IPAM using which you can install the tools you desire without any difficulty. To download the tool, head to this link and provide the required information and then click ‘Proceed to Free Download’. After that, follow the instructions given down below:
- Once you have downloaded the Orion Installer, run the file.
- Wait for the Orion Installer to load up. After it starts up, choose Lightweight Installation on the first page and choose where you wish to install the product by clicking Browse. Click Next.
Orion Installer - On the Products page, make sure Server Configuration Monitor is selected and then click Next.
- After that, the Orion Installer will run a few system checks so wait for that to finish.
- Next, accept the license terms and hit Next.
- Now, the installer will start downloading the installers for Server Configuration Monitor and then install the product. Wait for it.
- Once Server Configuration Monitor has been installed on your system, the Configuration Wizard will open up automatically. On the first page, click Next.
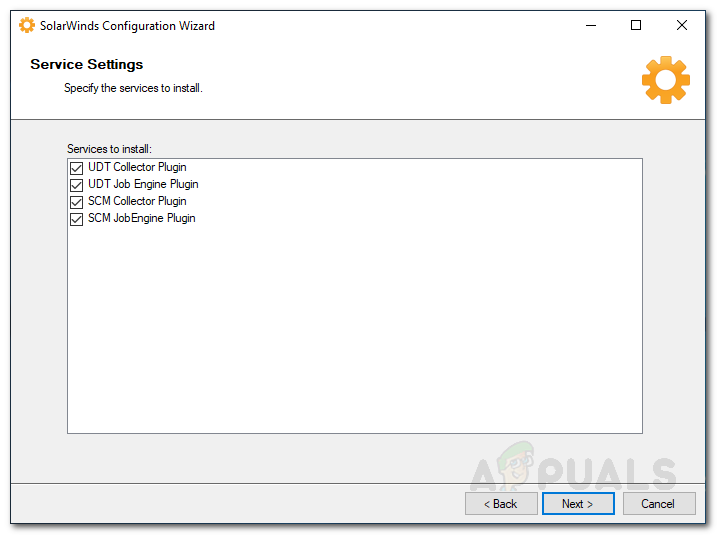
- Now, on the Service Settings page, just click Next again.
SCM Configuration Wizard - Hit Next again so that Configuration Wizard begins. Wait for it to finish configuring the product for your system and then click Finish.
Discovering your Network
Now that the tool has been deployed on your system successfully, you will have to discover your network using the Orion Web Console. The console comes with a Network Sonar Wizard that lets you discover your networks easily. Here’s how to do it:
- Once you click Finish on the Configuration Wizard, the web console should start-up in a web browser automatically. If it doesn’t, you can easily access it by typing ‘http://hostnameORipaddress:port’ in the address bar. The default port is 8787.
- It will ask you to create a password for the admin account, do that and then click Save & Login.
- In the toolbar, navigate to Settings > Network Discovery. There, click on Add New Discovery to start discovering your network.
- On the first page, you will have to choose a method of discovering your network. There are four options available, choose one and then provide the details. After that, click Next.
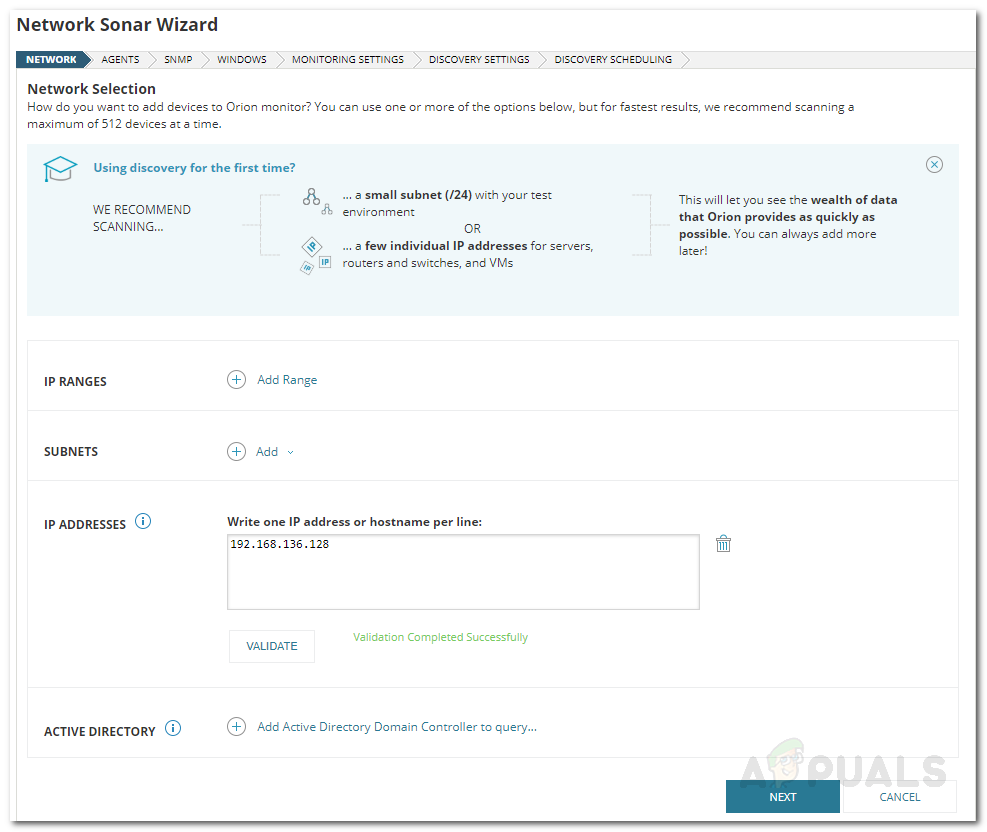
Network Discovery - Now, you will be taken to the Agents page. Tick the ‘Check existing nodes polled by an agent for node changes and updates’ option and click Next.
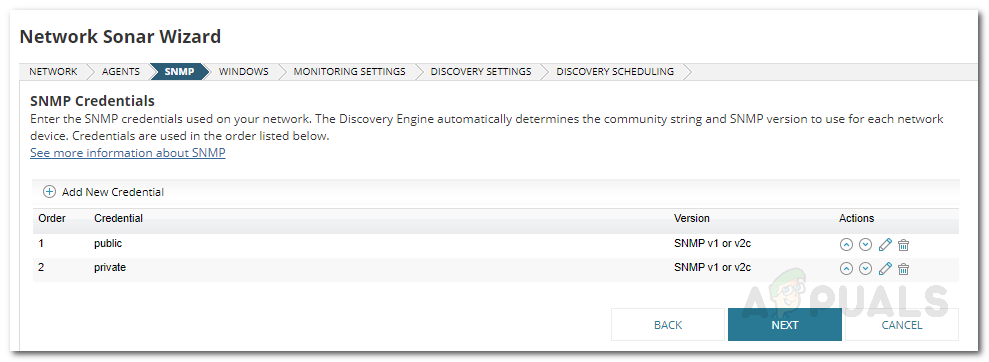
- On the SNMP page, if your devices are using SNMPv3 community strings, click on the Add New Credential button and then provide the required information. If you are using community strings (SNMPv1 and SNMPv2) other than private and public, add them using Add New Credential. If not, just click Next.
SNMP Discovery - After that, on the Windows page, if you are discovering Windows devices, add the credentials by clicking Add New Credential. Click Next.
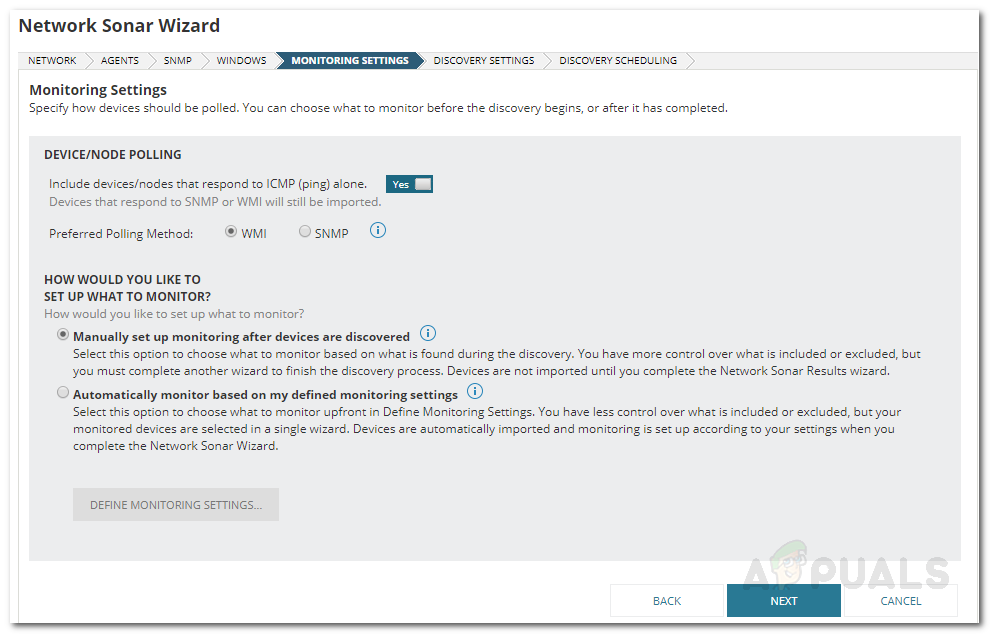
- Choose WMI as the polling method if you are discovering Windows devices. If you select WMI, it means that the wizard will prioritize WMI and then SNMP; it doesn’t mean that SNMP will be neglected. Other than that, leave ‘Manually set up monitoring after devices are discovered’ selected and click Next.
Monitoring Settings - Give your discovery a name for your reference on the Discovery Settings page and then click Next.
- If you wish to perform the scan more than once, change the Frequency on the Discovery Scheduling page. After that, click Discover.
- The discovery will begin, wait for it to complete.
Importing Discovered Devices
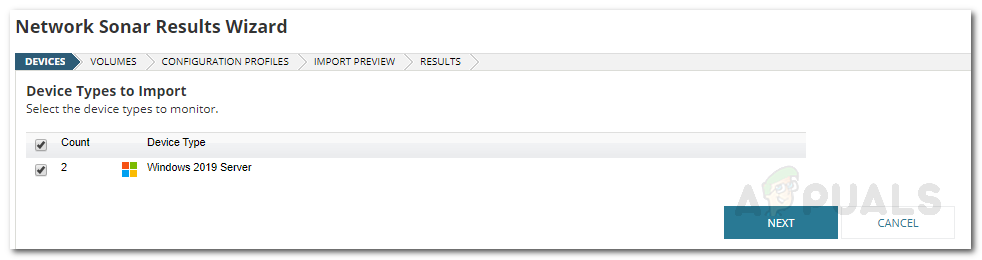
Once the Network Sonar Wizard completes, you will be taken to the Network Sonar Results Wizard. Here, you will be able to see the devices that have been discovered by the wizard. Now, it is time to import them. Here’s how to do it:
- On the Devices page, select the devices you want to import and then click Next.
Discovery Results - Select the types of volumes to monitor on the Volumes page. Then, click Next.
- Select the configuration profiles you want to monitor on the Configuration Profiles page. Click Next afterward.
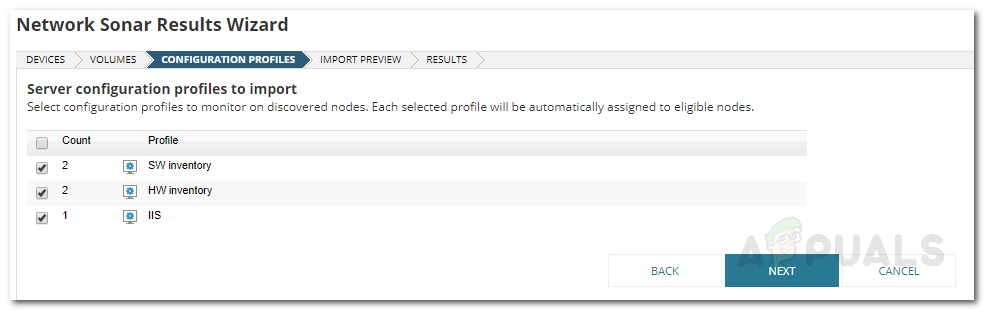
Configuration Profiles to Import – Discovery Results - Preview the summary of the devices to be imported on the Import Preview page. Click Import.
- Wait for the devices to be imported and then click Finish on the Results page.
Enabling Real-Time File Monitoring
Server Configuration Monitor enables you to monitor your server configurations and also see which user made what configuration changes. To enable this, follow the instructions given below:
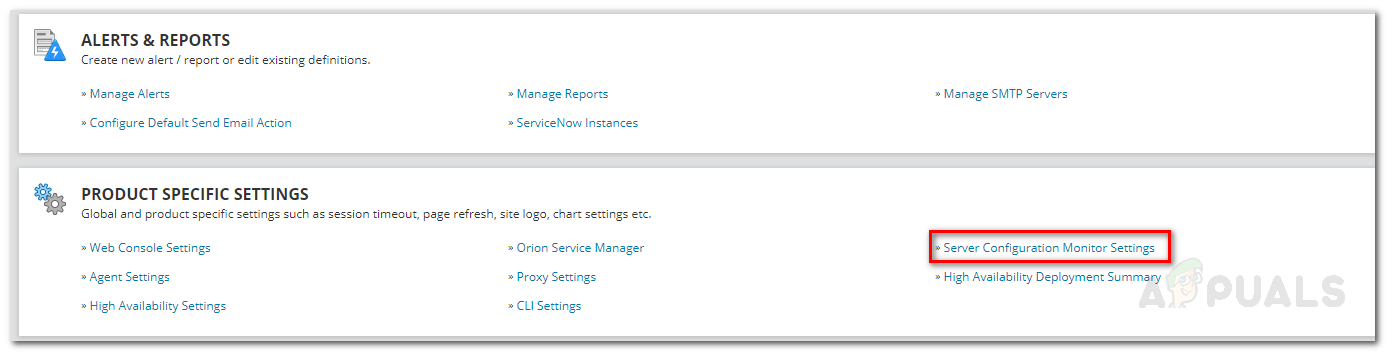
- In the toolbar, navigate to Settings > All Settings.
- Under the ‘Product Specific Settings’ heading, click Server Configuration Monitor Settings.
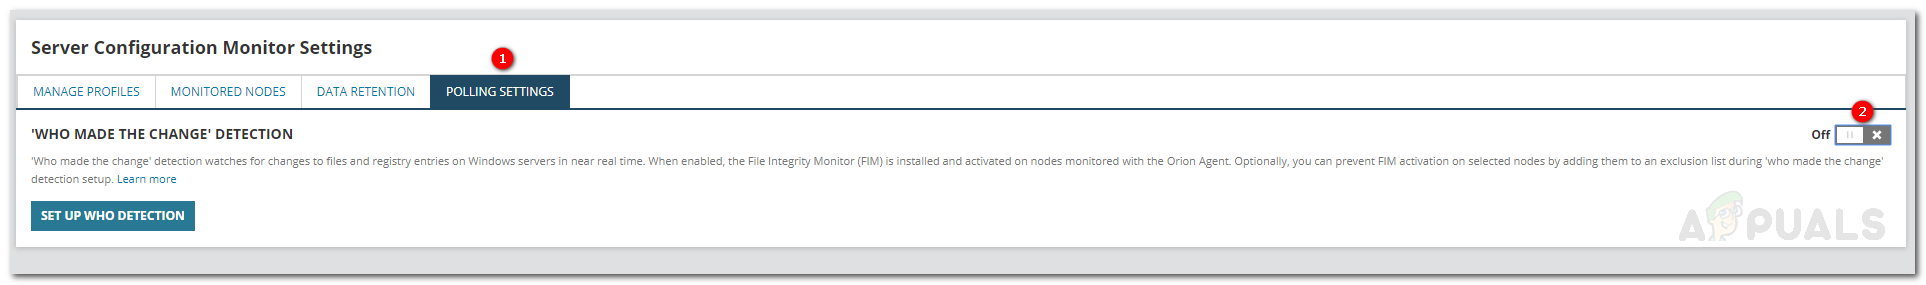
Server Configuration Monitor Settings - Switch to the Polling Settings tab and then click the switch to turn on ‘Who Made the Change’ Detection.
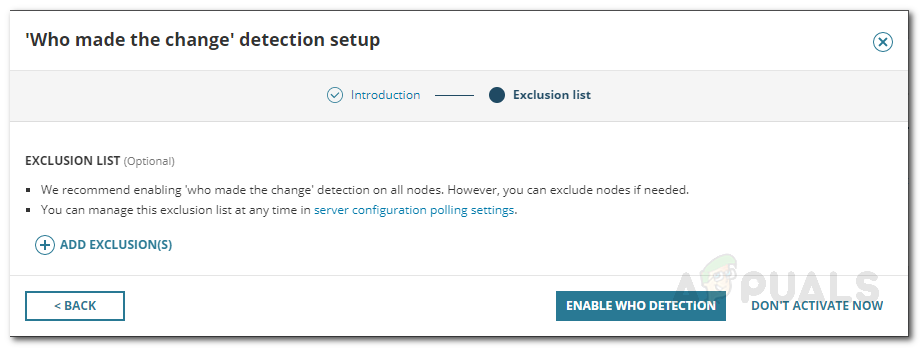
Enabling Real-Time File Monitoring - Once you click on the switch, you will be prompted the ‘Who Made the Change’ detection setup. Click on Continue to Setup.
- You are given the choice of disabling the real-time file monitoring for different nodes. If there are nodes that you wish to exclude from this, just click Add Exclusion and then select the node from the list.
- If you wish to enable it for all nodes, simply click on Enable Who Detection.
Enabling Who Detection
Managing Profiles
SCM comes packed with several predefined profiles that you can configure as well as add new custom profiles per your needs. To manage profiles, do the following:
- Go to the Server Configuration Monitor Settings as instructed above.
- On the Manage Profiles tab, you can check the predefined profiles and make changes per your needs.
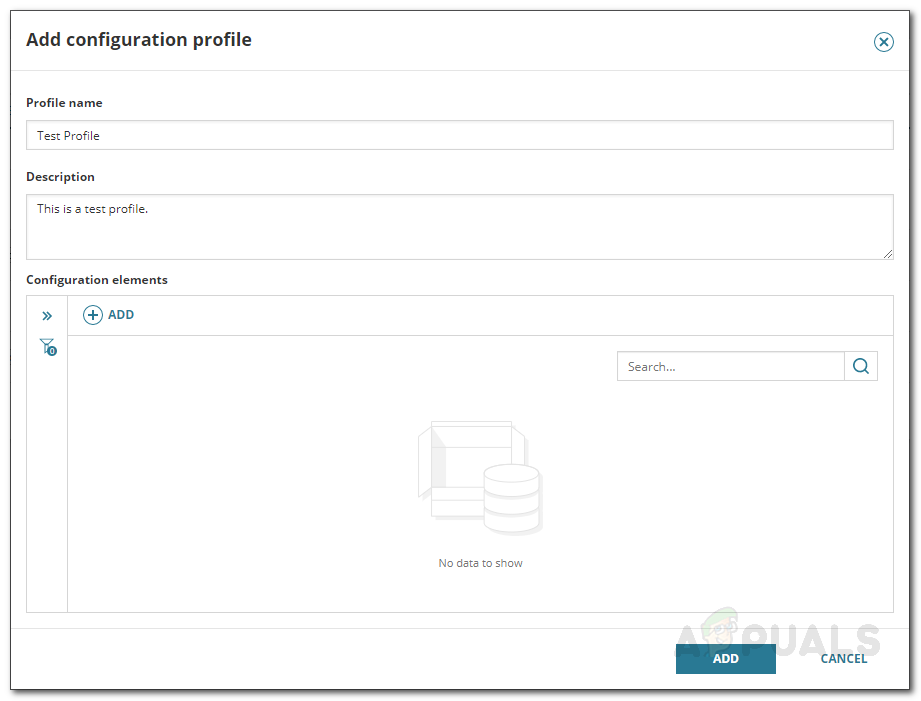
- If you wish to add a new custom profile, simply click on Add.
- Provide the Profile a name, give it a description and then add Configuration Elements per your requirements. After that, click on Add.
Adding Custom Configuration Profile
Start Monitoring
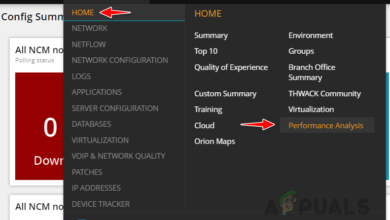
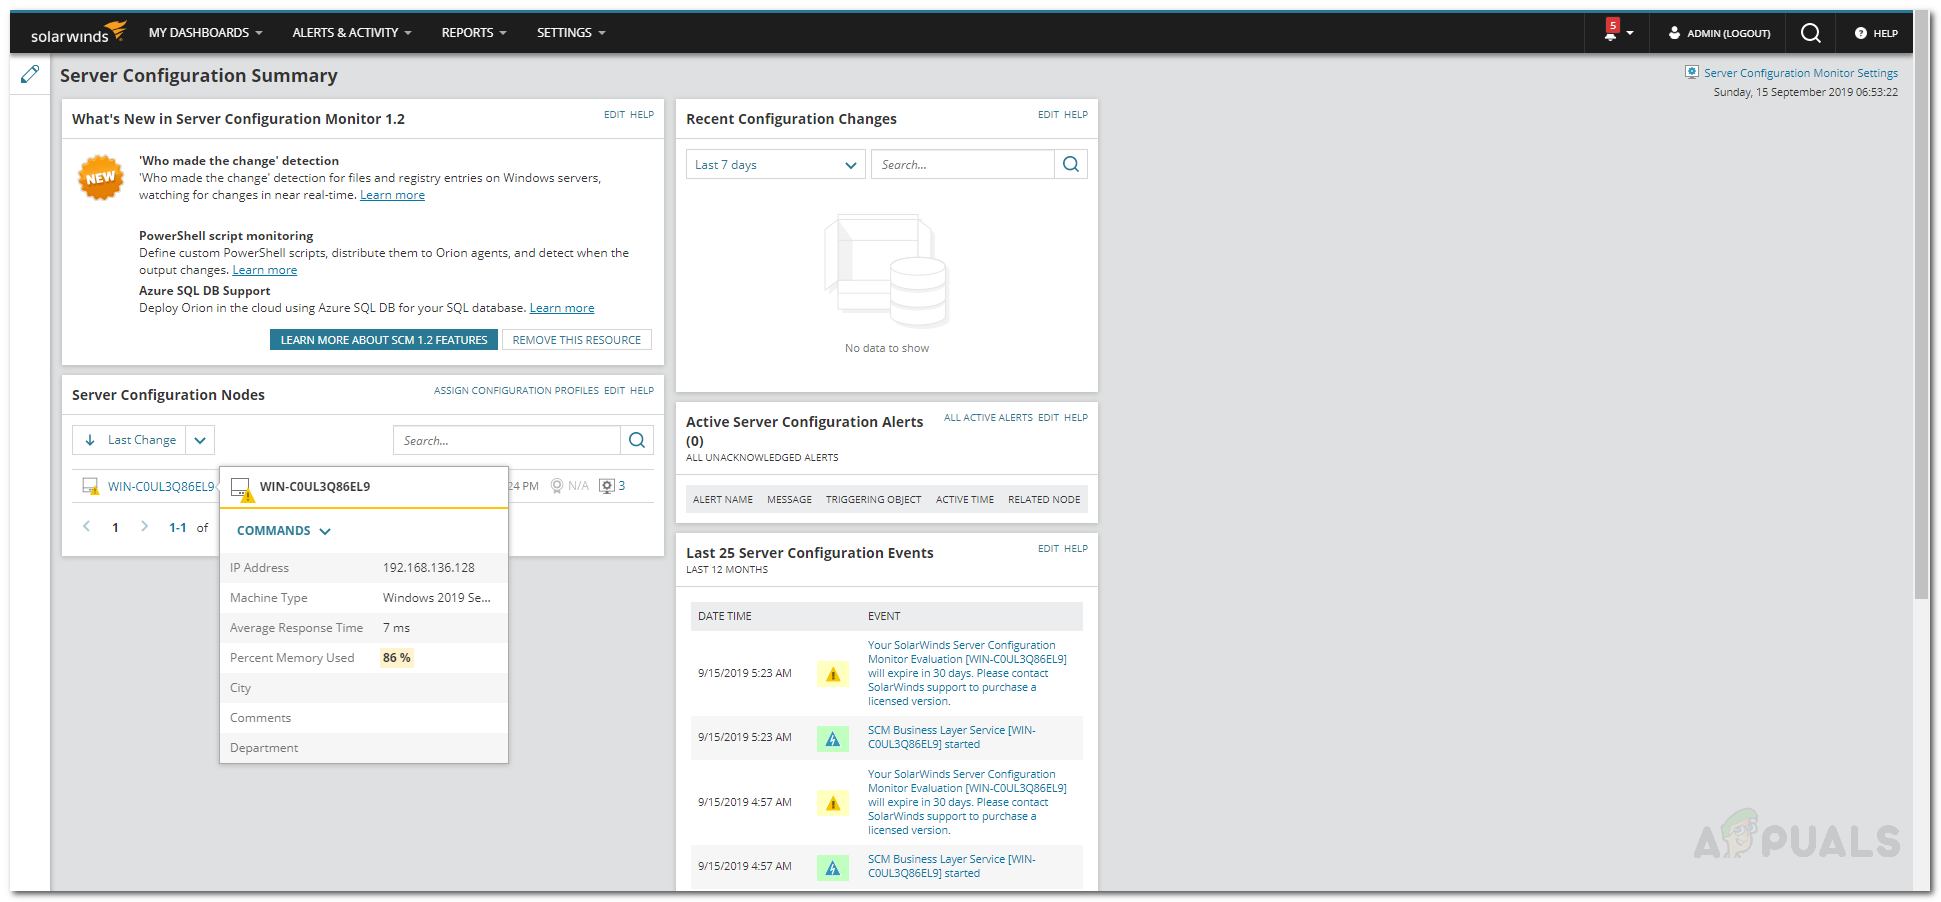
With that, you are all set and you can start monitoring the added nodes just from a computer screen. To open up the monitoring page, just navigate to My Dashboard > Server Configuration > Server Configuration Summary.