Custom Profiles & Monitoring in Server Configuration Monitor
Every network infrastructure out there has various servers for different purposes. The configuration files are responsible for the behavior of the server. Configuration files can be found everywhere, be it the network config files or the server config files. In a large network, keeping track of the changes made into the config files can be really tough considering the number of employees that have access to the files and are working on it. Without a proper tool, this seems to be impossible. However, thanks to the modern world, if there is a problem in network or server management, an automated tool has already been developed and can relieve you of the nightmare of going through hundreds of lines.
Solarwinds Server Configuration Monitor is a tool built for the same purpose in mind. There are tons of server monitoring tools that you will be able to find in the market, however, none would be able to keep up with the reliability offered by Solarwinds SCM. In this competitive era, you simply cannot afford any downtimes in your network and need to ensure an always operational system. This cannot be achieved via ordinary means and therefore, automated tools need to be implemented in the network that will help your IT admins to monitor configuration files much easily.
Download the Server Configuration Monitor
Solarwinds Server Configuration (download here) is the perfect tool for monitoring your server config files and configuration settings in real-time. With SCM, you will be able to detect any unauthorized changes into the configuration files of your servers as well as applications on your network via performance counters. You can also create a baseline config to which other config files will then be compared to. If there are any anomalies detected in the other configuration options when compared to the baseline, you will be automatically notified of the changes via the notification profiles or the alerts so that it can be rectified. Server Configuration Monitor provides enhanced monitoring settings by integrating with the Solarwinds NPM.
In this guide, we will be showing you how to create custom profiles and monitor specific configuration changes with the help of the Server Configuration Monitor. In order to follow through, you will have to install the tool in your network. Therefore, you can free download it from the link provided above. If you wish to evaluate the tool first, Solarwinds offers a free trial that you can avail of to see the product. To help you get started with the tool, we have published a “Monitor Server Configuration” article on our site that explains the first steps in quite a detail.
Creating Custom Profiles
Solarwinds Server Configuration Monitor enables you to create your separate profiles for your systems along with the out-of-the-box configuration profiles (XML files) that come built-in the tool. Creating custom profiles for your system enables you to make change detectors for your system. This will help you in monitoring files and registry changes. Here’s how to create a custom profile:
- Log in to the Orion web console and then make your way to the Server Configuration Monitor Settings via Settings > All Settings > Server Configuration Monitor Settings.
- Hit the Add button at the top of the profiles tab.
- Provide a name for the profile and a description which is optional.
- Now, add configuration elements to the Profile via the Add button. Select an element type from the drop-down menu.
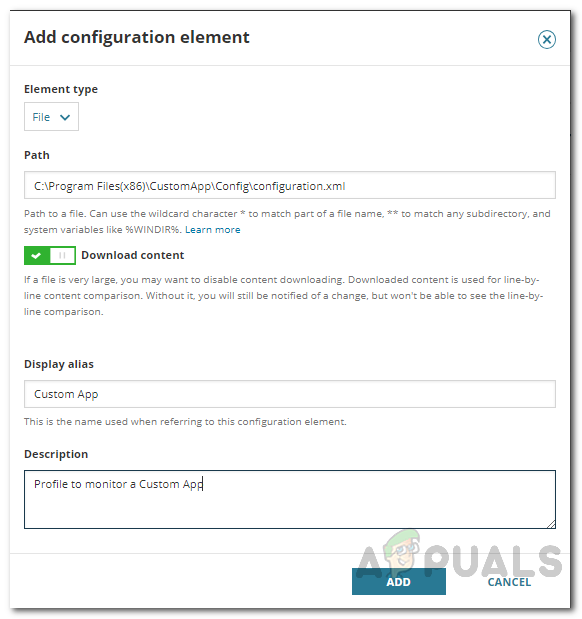
Configuration Element - After that, provide a path or enter a registry key (depending on the element type you have selected) for the element.
- Optionally, you can provide an alias for the element as well as provide a description.
- Finally, click the Add button to add the custom profile.
- You can also test the profile on a node to see if the custom profile works as you want it to.
Monitoring Specific Configuration Changes
With the help of the Server Configuration Monitor, you can also create a recent changes widget on the dashboard of SCM. This enables you to keep track of specific configuration changes that are important to you. To be able to do this, you will first have to add a recent changes widget and then edit it per your needs.
Here’s how to add the widget:
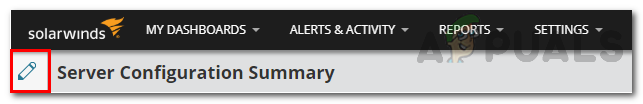
- Move your cursor to the pencil icon before the Server Configuration Summary text.
SCM Dashboard - Click on the Customize Page option.
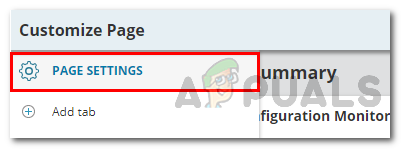
- After that, click on Page Settings.
Customizing Page - In the second column, click on the Recent Configuration Changes entry to highlight it.
- After that, click on the third icon in the icons column next to the second column.
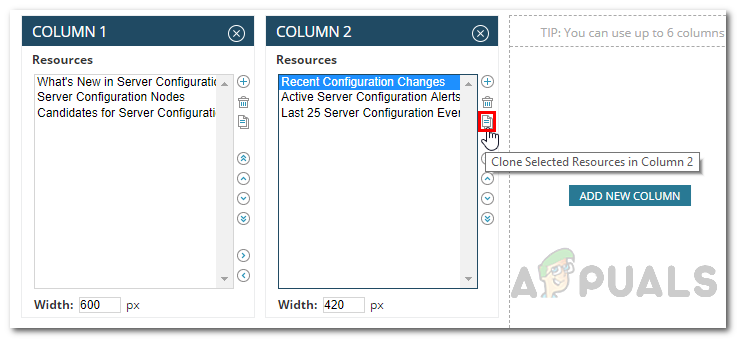
Page Settings - Once you have done that, click on the Done button.
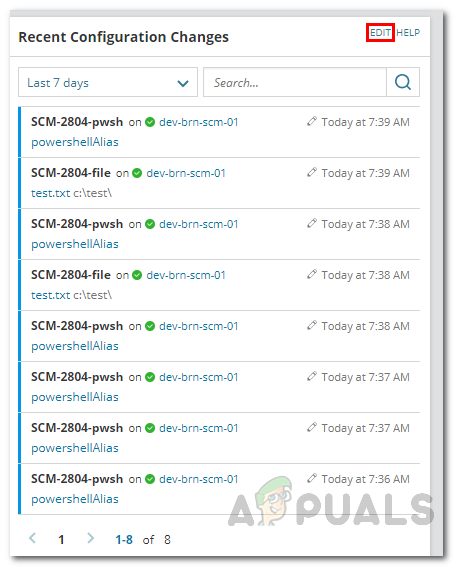
- Now, head back to the dashboard and navigate to the cloned instance of Recent Configuration Changes.
- Click on the Edit option found on the top-left of the widget.
Newly Added Widget - Select the predefined filters per your requirements. Once you have done so, click on the Save button.
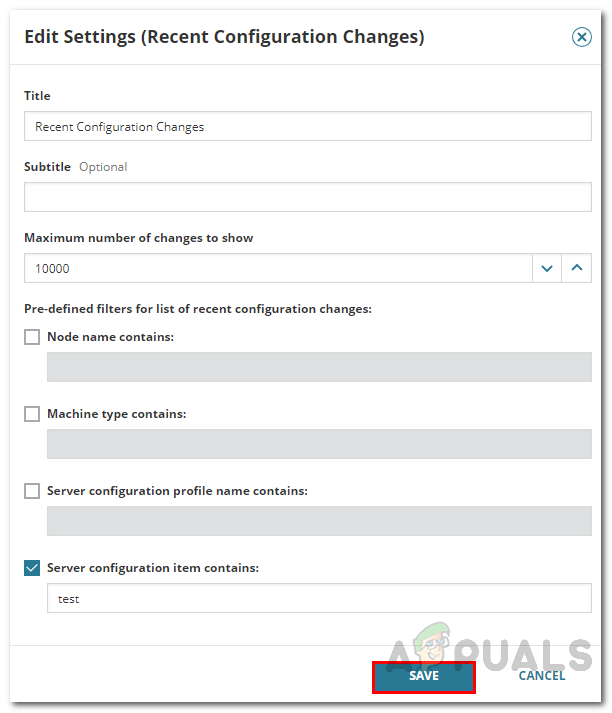
Editing Widget - Now, the widget will show configuration changes per your selected filters. This is how you will be able to monitor any specific configuration changes.