Why is there a Debug File on my Computer and How to Fix it?
The Debug file (debug.log or debug.txt) on your system’s desktop may show up mainly due to a bug in chromium-based browsers. Moreover, a corrupt user profile or browser installation may also result in the Debug file on the desktop of your system.
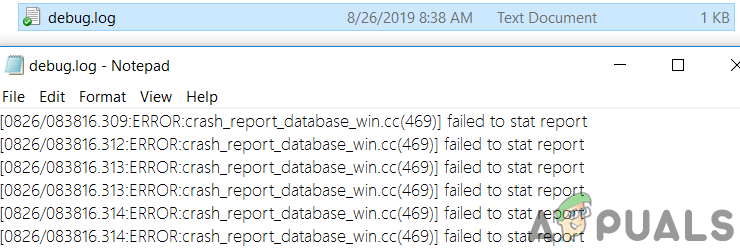
The issue arises when the user sees a debug file on his desktop. When the debug file is opened with Notepad, something like below is shown:
[1101/180331.337:ERROR:directory_reader_win.cc(43)] FindFirstFile: The system cannot find the path specified. (0x3)
Before proceeding with the troubleshooting process, make sure the Windows of your PC is updated to the latest build. Moreover, check if clearing the temp files solves the issue. Also, check if you are using Google Talk (although discontinued since 2015 but some users still using it). If so, then try to repair its installation through the Control Panel of your system.
Solution 1: Delete the Debug File
The first step in the troubleshooting process of this issue is to delete the unnecessary debug file itself (the file may be recreated after a system/application startup). You may have to repeat these steps after every attempted solution.
- First, make sure that the Debug file is not required by you or any other system user/application, and then exit all the applications on your system (check the Task Manager of your system for any background applications).
- Now, right-click on the Debug file and then select Delete.
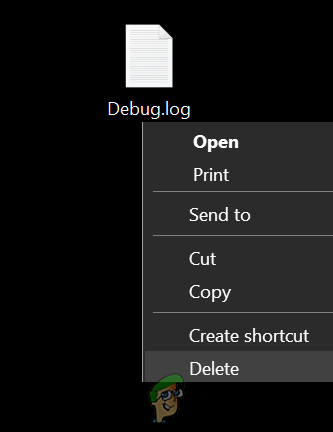
Delete the Debug File - Then confirm to delete the file and check if the file is deleted.
- If not, then boot your system into Safe Mode or Clean Boot your system and then check if you can delete the file. You may have to use “rm.\debug.log” in the elevated power shell.
Solution 2: Update Your Browser to the Latest Build
Nearly all the major browsers are updated regularly to cater to the latest features and patch bugs. Your system may show the Debug file on the desktop if you are using an outdated version of your browser as it can create incompatibility between the browser and OS and hence create a debug file on your Desktop for troubleshooting purposes. In this case, updating the browser to the latest build may solve the problem.
For Chrome:
- Launch the Chrome browser and click on three vertical ellipses (near the top right of the window).
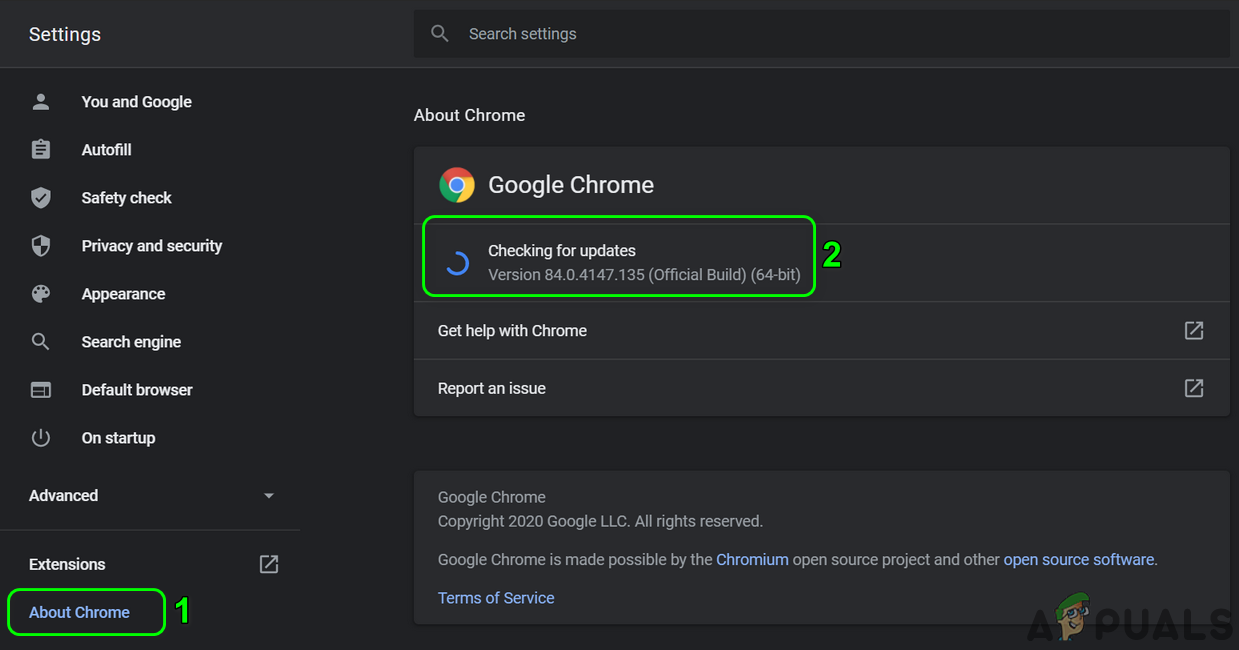
- Now, in the menu displayed, choose Settings and then in the left half of the window, choose About Chrome.
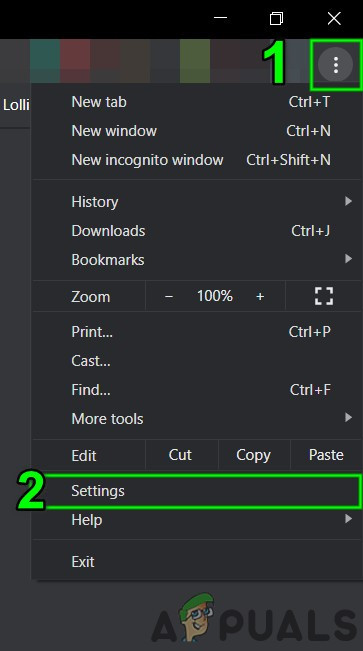
Open Chrome Settings - Then, in the right half of the window, make sure Chrome is updated to the latest build.
Update Chrome - If you are using Visual Studio Code, then make sure to update the debugger config file linked to Chrome.
For the Edge Browser
- Launch the Edge browser and click on three horizontal ellipses (near the top right of the screen).
- Now, click on Help & Feedback and then, in the sub-menu, select About Microsoft Edge.
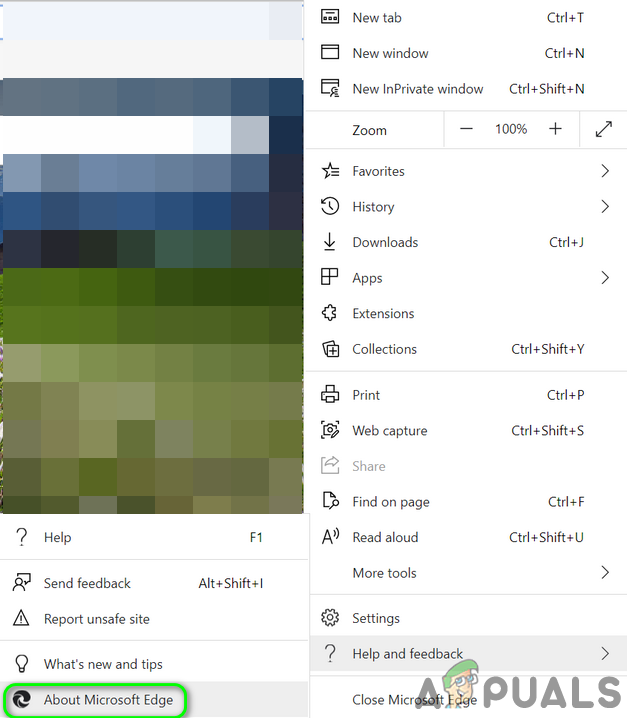
Open About Microsoft Edge - Then make sure the Edge browser is updated to the latest build.
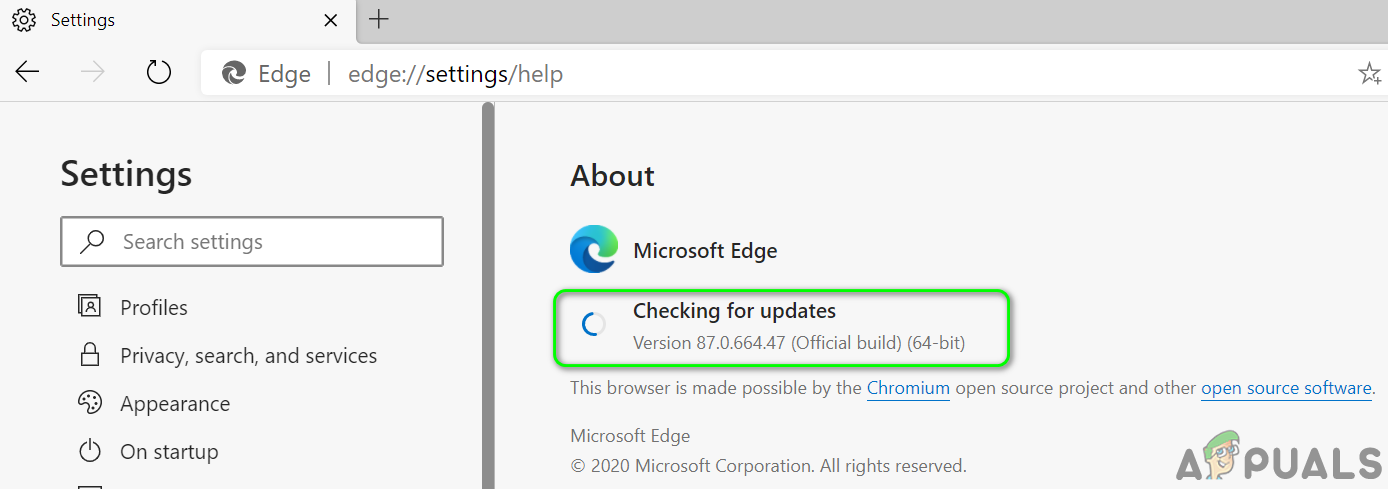
Check for Microsoft Edge Updates
After updating the browsers (Chromium-based), reboot your PC and upon reboot, check if the system is clear of the debug file.
Solution 3: Open PDF Files in another Browser/Application
The creation of a Debug file is a reported bug on Chromium-based browsers, especially when the browser is used to download/open PDF files. In this context, opening the PDF files with a browser that is not Chromium-based (like Firefox or Safari) or another application may solve the problem.
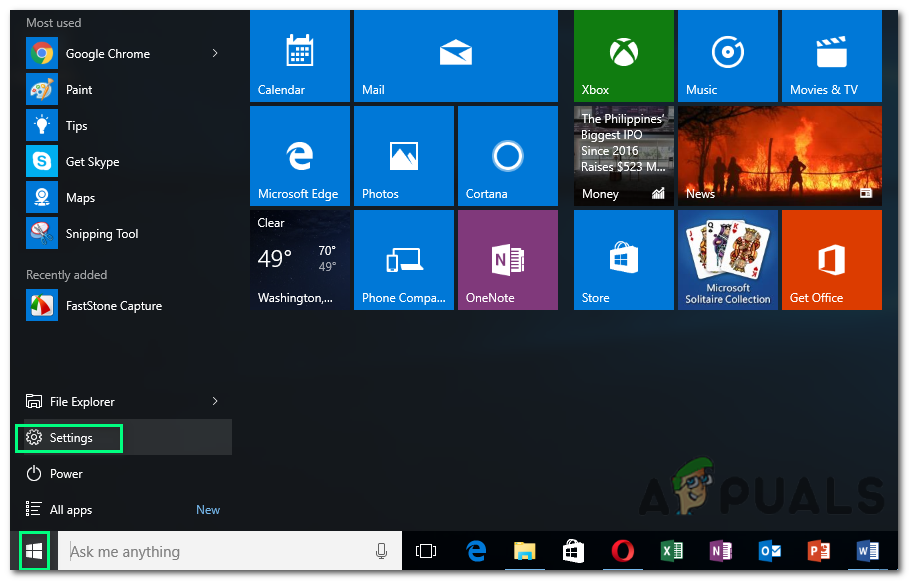
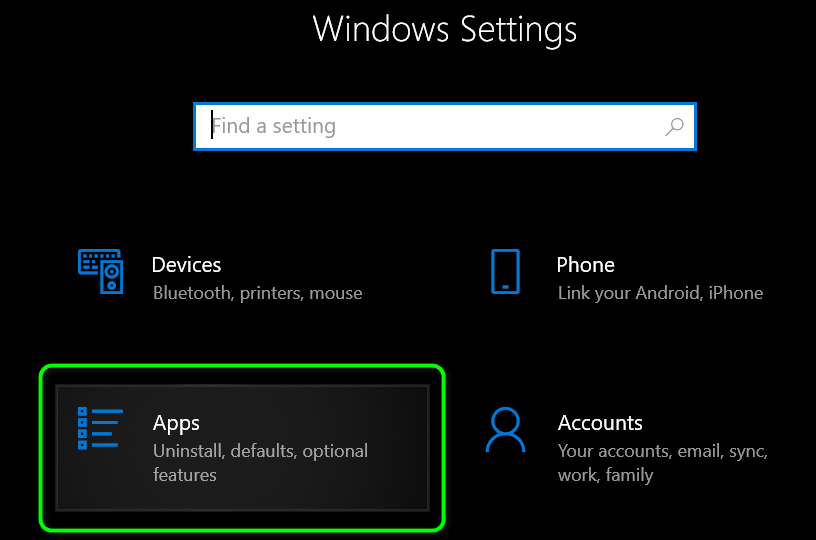
- Open the Windows menu by pressing the Windows logo key and then click on the Gear icon to open the system’s Settings.
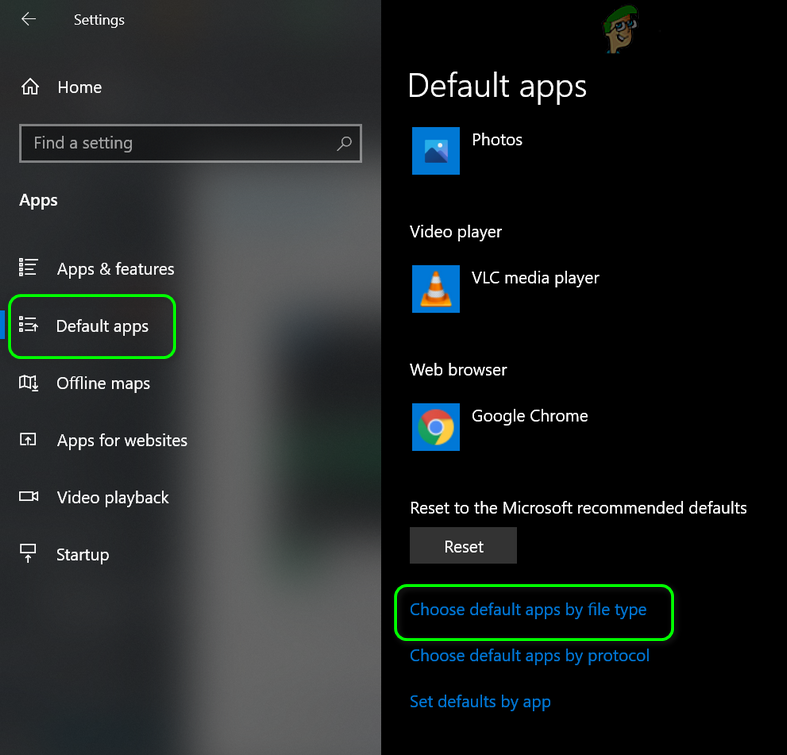
Opening Windows Settings - Then select Apps and in the left half of the window, choose Default Apps.
Open Apps in Windows Settings - Now, in the right half of the window, scroll down and then click on Choose Default Apps by File Type.
Open Choose Default Apps by File Type - Then scroll down till you find the option of “.PDF” and then click on the application in front of it.
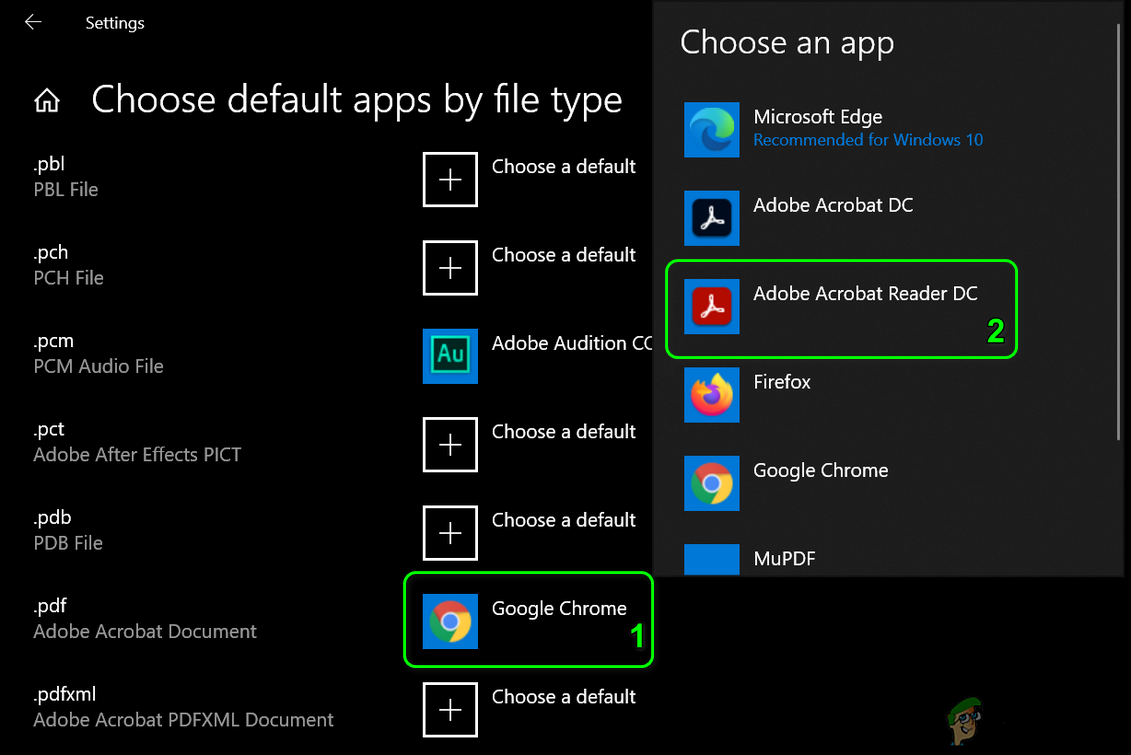
Change the Default App for the PDF File Type - Now, in the options shown, select another browser (not Chromium-based) or application (e.g. Adobe Acrobat Reader DC).
- Then reboot your system and upon reboot, check if the system is clear of the debug file issue.
Solution 4: Disable Microsoft Edge Developers Tools
You may encounter the error at hand if the Developer Tools of Microsoft Edge browser are enabled as its ability to edit the front-end workflows may cause the conflict between the application and OS. In this context, disabling the developer tools of Microsoft Edge may solve the problem.
- Launch the Run box by pressing the Windows + R keys and execute the following:
gpedit.msc

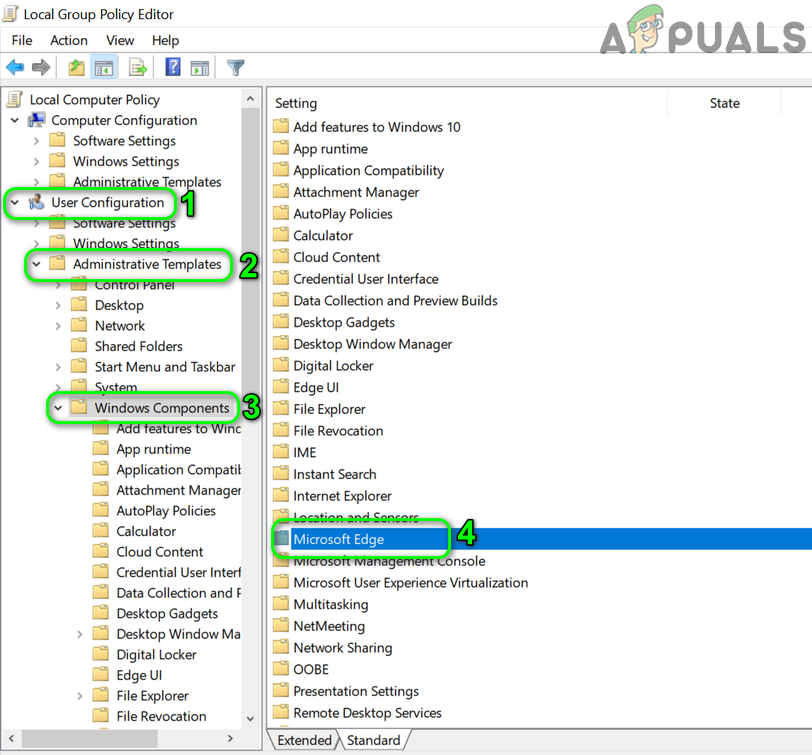
Type gpedit.msc and Press Enter To Open Group Policy Editor - Now, in the left pane of the window, expand User Configuration and then Administrative Templates.
- Now expand Windows Components and then double-click on Microsoft Edge.
Open Microsoft Edge in the Group Policy Editor - Then, in the right pane of the window, right-click on Allow Developer Tools.
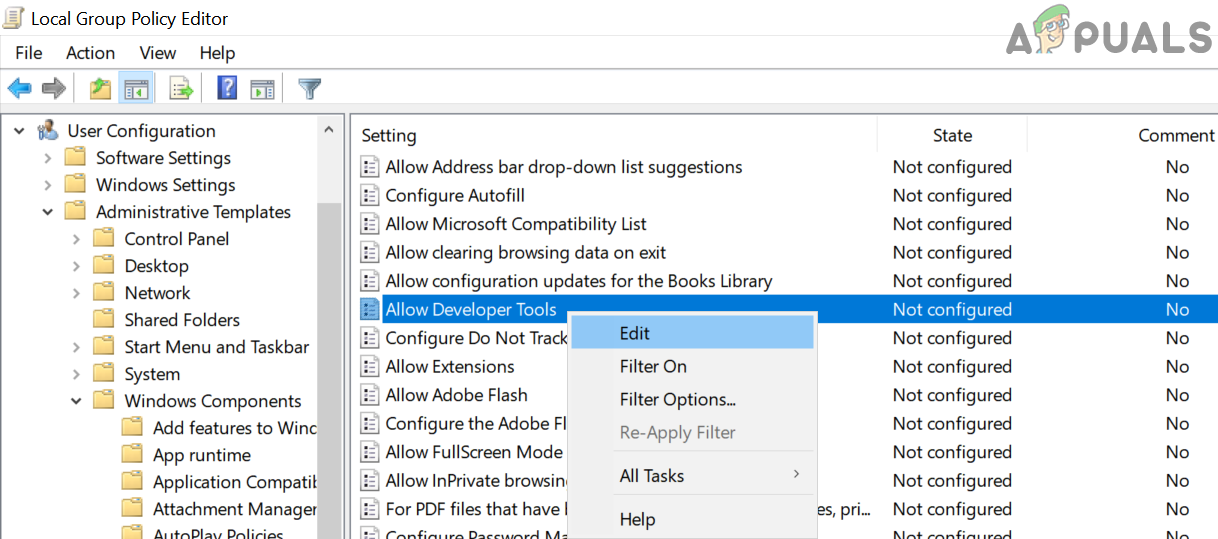
Edit Allow Developer Tools Settings - Now select Edit and choose Disabled.
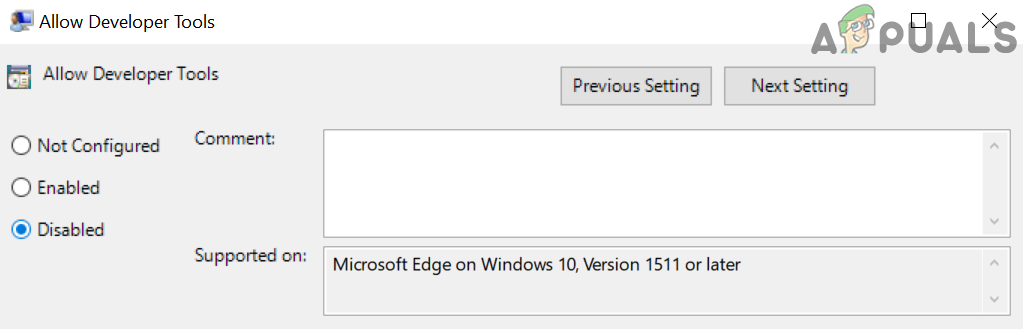
Disable Allow Developer Tools of Microsoft Edge - Then, click on Apply/OK buttons and reboot your PC.
- Upon reboot, check if the Debug file issue is resolved.
Solution 5: Delete the Debug File from the Startup Folder
Your system may show the Debug file on its desktop if the debug file is located in the startup folder (due to which file will be recreated on every system restart). In this scenario, removing the file from the startup folder may solve the problem.
- Launch the Run box (by simultaneously pressing Windows + R keys) and execute the following:
%appdata%\Microsoft\Windows\Start Menu\Programs\Startup
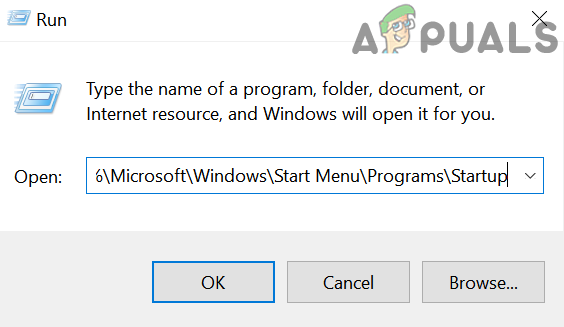
Open Startup Folder - Now right-click on the Debug file and then choose Delete.
- Then confirm to delete the file and right-click on the Taskbar of your system.
- Now, in the menu displayed, choose Task Manager and navigate to the Startup tab.
- Then uncheck the option of Debug file and reboot your PC.
- Upon reboot, check if your system is clear of the debug file error.
Solution 6: Delete the Crashpad Folder
The debug file on the desktop of your system may be shown if the Crashpad folder related to Chrome is corrupt. In this context, deleting the Crashpad folder may solve the problem.
- Exit the browser of your system (like Chrome) and make sure no process related to the browser is operating in the Task Manager of your system.
- Launch the Run box (by pressing Windows + R keys) and execute the following:
%LocalAppData%\Google\Chrome\User Data
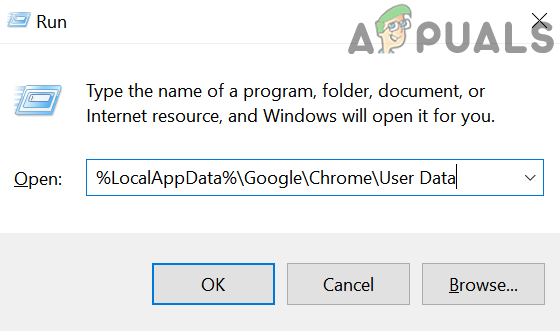
Open the Chrome User Data Folder - Now right-click on the Crashpad folder and then select Delete.
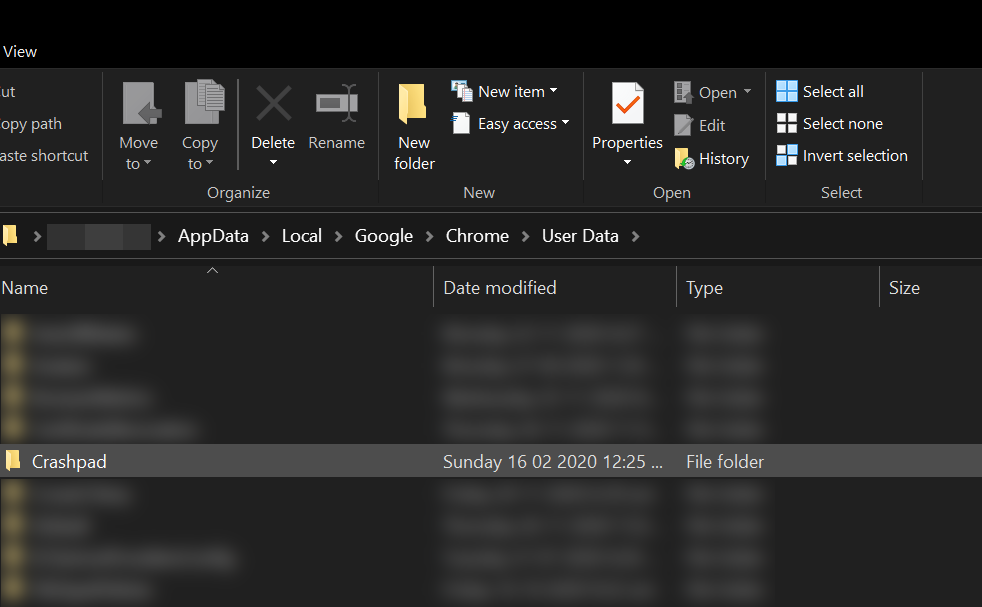
Delete the Crashpad Folder - Then confirm to delete the folder and reboot your PC.
- Upon reboot, check if the debug file issue is resolved.
Solution 7: Clean Boot Windows
Your system may show the Debug file on its desktop if any of the system applications are creating the file at the system’s start-up. In this context, clean booting the system may solve the problem.
- Boot your system into the safe mode with networking and check if the Debug file is generated.
- If not, then boot your system in normal mode and then clean boot your system.
- Now, check if the Debug issue is resolved. If so, then try to find out the problematic application by enabling the applications in the Windows startup settings one by one. Adobe Photoshop, OneDrive (when the client is not running but File Explorer is used for editing the files in the OneDrive folder) and Visual Studio are some of the applications known to create the issue.
Solution 8: Uninstall the New Microsoft Edge Update
Microsoft is known to release buggy updates and one such update is KB4576754 (the latest Microsoft Edge update). In this scenario, uninstalling the buggy update may solve the problem.
- Press the Window logo key to launch the Windows Menu and then search for Settings. Then, select Settings (in the list of results pulled by Search).
- Now choose Update & Security and then open View Update History.
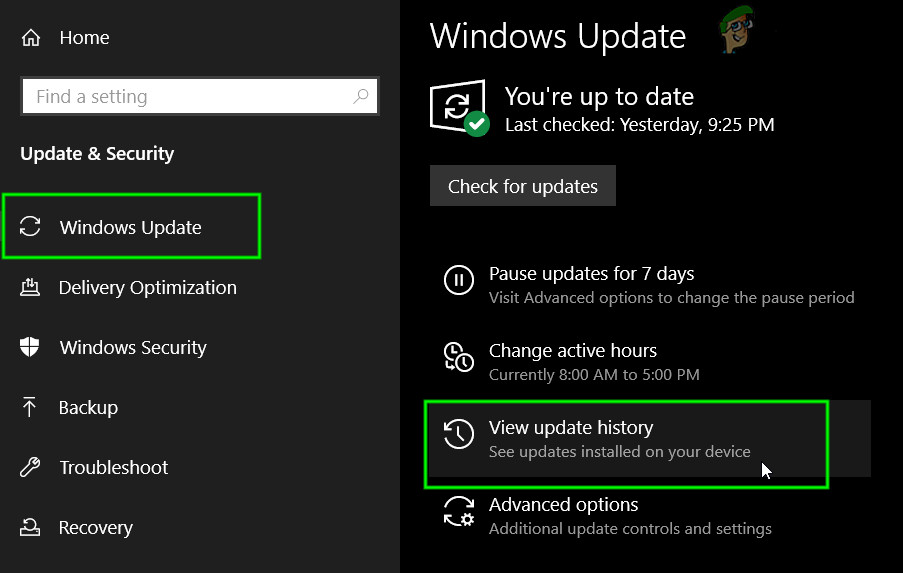
Open View Update History - Then click on Uninstall Updates and select KB4576754 update.
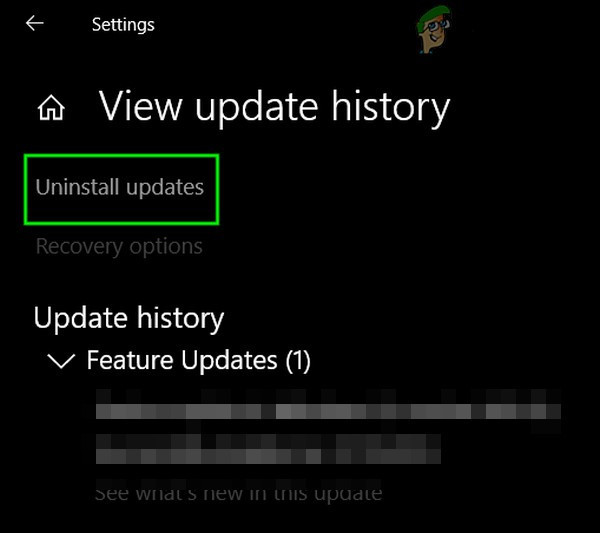
Uninstall Updates in Update History - Now click on Uninstall and then follow the prompts on your screen to uninstall the buggy update.
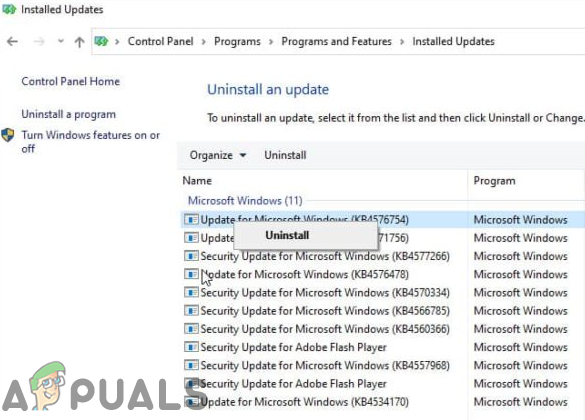
Uninstall Update KB4576754 - Then reboot your PC and upon reboot, check if the debug file issue is resolved.
Solution 9: Reinstall the Browser
You may encounter the error at hand if the installation of your browser is corrupt. In this scenario, reinstalling the browser may solve the problem. You should try to reinstall Microsoft Edge and Chrome browser (we will discuss the reinstallation process for Chrome) as the issue is reported on Chromium-based browsers (you should also reinstall all the chromium-based browsers).
- Backup the essential information/data in Chrome (Bookmarks, Passwords, etc.).
- Now, exit Chrome and make sure no process related to it is operating in the Task Manager of your system.
- Then click on the Windows button to open the Windows menu and then click on the Gear icon to launch the system’s Settings.
- Now select Apps and then expand Google Chrome.
- Then click on the Uninstall button and confirm to uninstall Google Chrome.
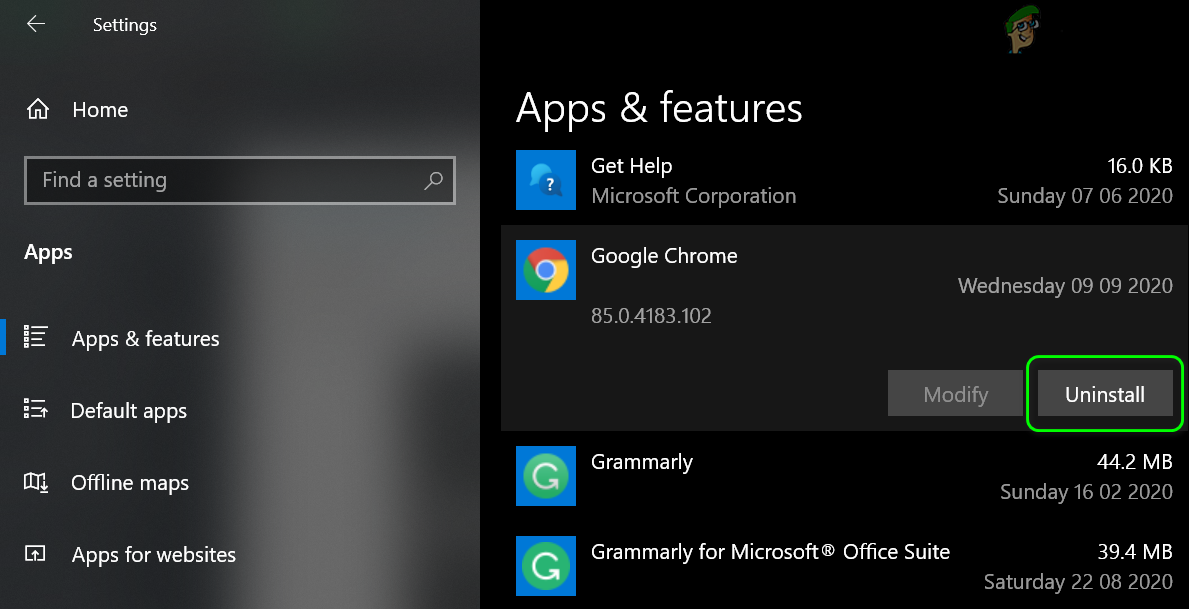
Uninstall Chrome in the System Settings - After uninstalling Chrome, reboot your PC, and upon reboot, delete the following directories:
C:\Program Files\Google\Chrome

%LocalAppData%\Google\Chrome
- Now launch the Windows menu by clicking on the Windows button and then search for Registry Editor. Now, in the results shown by the search, right-click on Registry Editor and select Run as Administrator.
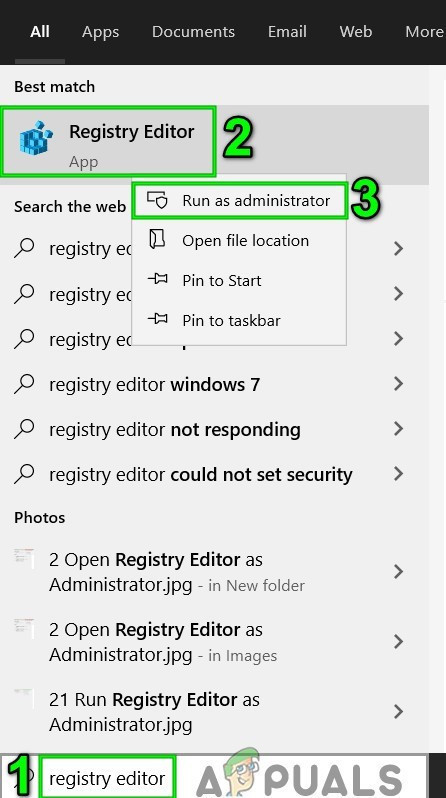
Open Registry Editor as Administrator - Click Yes (if the UAC prompt is received) and then back up the system’s registry.
- Now, navigate to the following:
Computer\HKEY_CURRENT_USER\SOFTWARE
- Then right-click on Google (in the left half of the screen) and then Delete the key.
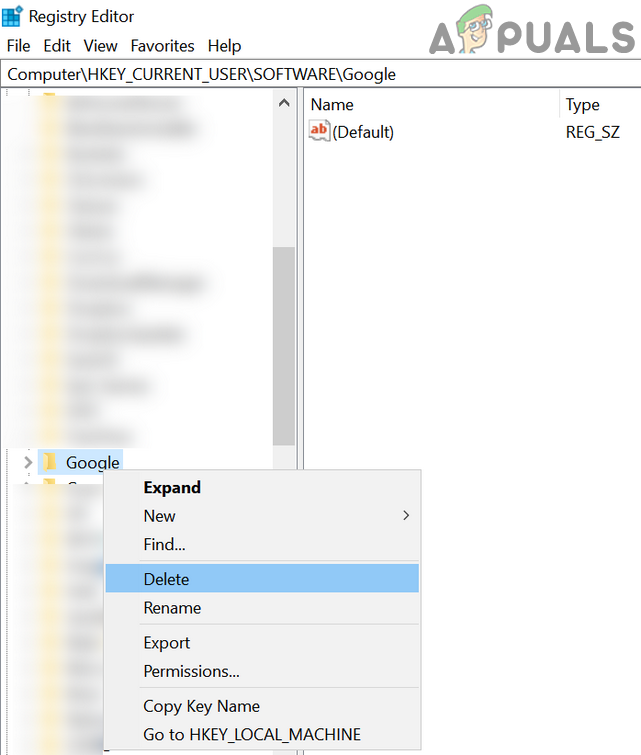
Delete the Google Folder from Current User of Registry - Now, navigate to the following:
Computer\HKEY_LOCAL_MACHINE\SOFTWARE\
- Then right-click on Google (in the left half of the screen) and then Delete the key.
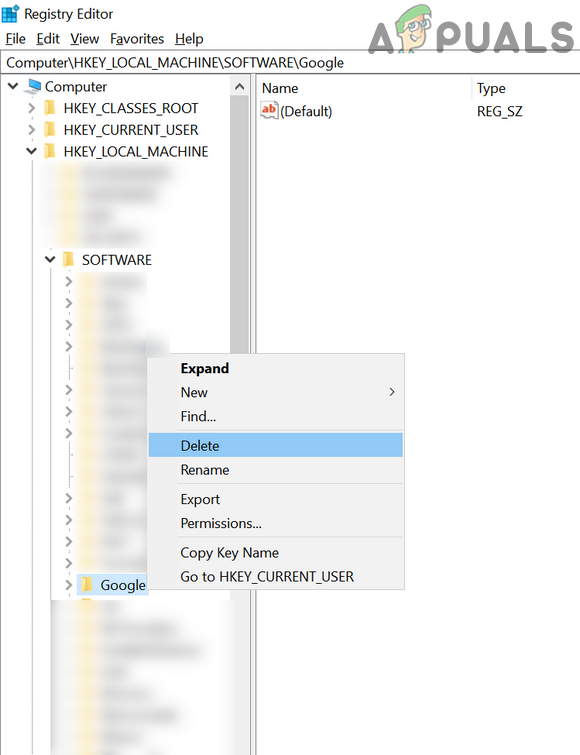
Delete the Google Folder from HKLM of Registry - Now open the File Menu and click on Exit to close the Registry Editor.
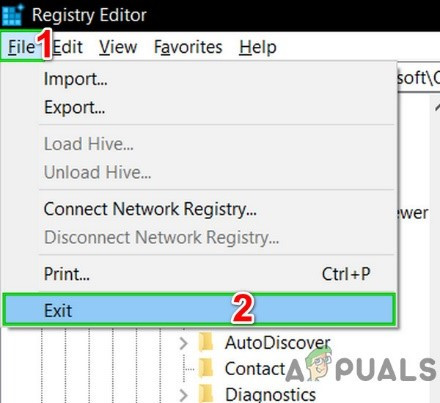
Exit Registry Editor - Then reboot your machine and upon reboot, download the latest version of the Chrome installer (better to use the offline installer).
- Now, right-click on the downloaded setup file of Google Chrome and select Run as Administrator, and then follow the prompts to complete the reinstallation.
- After reinstalling Chrome, check if the Debug file issue is resolved.
Solution 10: Create Another User Account
You may encounter the error at hand if the user profile of your system is corrupt. In this context, creating another user account may solve the problem.
- Create another user account and log off from the current account.
- Now, open the system with the newly created account and check if the debug file issue is resolved.
Solution 11: Hide the File and Make it Read-Only
If none of the solutions was effective in solving the issue, then hiding the file (so the existence of the file does not bother you) and making it readable (the application creating the file will not be able to edit or recreate it) may solve the problem.
- Make sure that Don’t Show Hidden Files, Folder, or Drives is enabled in the View menu of Folder Options. Also, close all the applications running and check the Task Manager of your system for any background applications running.
- Now, right-click on the debug file and then select Properties.
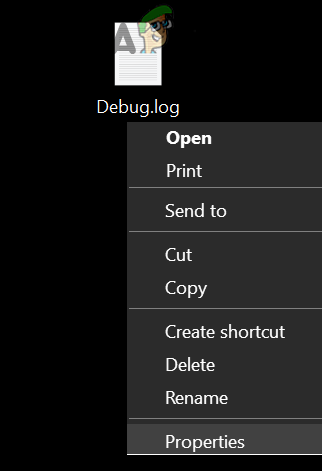
Open Properties of the Debug File - Then check the options of Read-Only and Hidden.
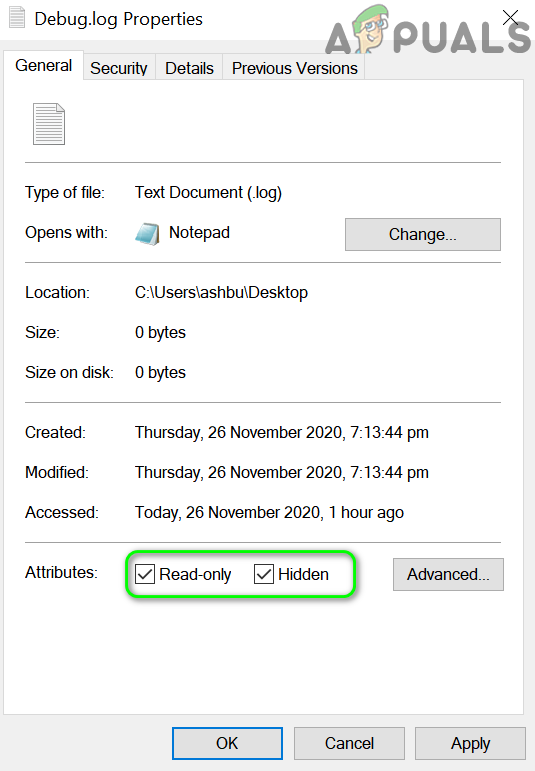
Make the Debug File Read-only and Hidden - Now, click on the Apply/OK buttons and then reboot your system.
- Upon reboot, hopefully, your system is clear of the Debug file issue.