AppOptics Review: Application Performance Management
In the business and IT world, if you don’t keep up with current trends then you are done. Cloud computing is the “it” thing right now and it has revolutionized how businesses in every industry operate. One notable effect is the increased use of applications as a means of interaction between businesses and their customers. But there is just one problem. Businesses are now faced with a new challenge of maintaining optimal performance of their applications to achieve maximum customer satisfaction. And this is where the SolarWinds AppOptics software comes in. It is not the only Application Performance Monitor you can use but in my opinion, and countless other experts, it distinctively stands above the rest. Reason?
Why AppOptics is Different from Other APM Solutions
First and foremost, it’s because AppOptics gives you complete visibility into both your applications and infrastructure. Usually, you would have to use a different tool for each environment. The tool is a combination of two other popular tools from SolarWinds, Librato, and Traceview, which allows you to monitor the performance of web apps in your business as well as monitoring your whole stack in real-time.
Moreover, AppOptics can support multiple languages and frameworks right off the box. These are Java, PHP, Python, Ruby, Node.js .NET, and Scala.
Why do I need an Application Monitor When I have a Network Performance Monitor
Good question and probably one that you may need to explain to the business owners or the people in charge of procurement. And the answer is simple. The Network Monitor is used for generalized monitoring. So for instance, it will notify you when an application is unreachable but it will not help in troubleshooting the application to identify the root problem.
On the hand, an application monitor is built to collect various performance metrics of your applications which will be crucial in problem identification. Worse still, if you are using just the NPM it’s entirely possible to miss a performance issue such as slow loading time as long as the end-user is still able to access the application.
The Different Types of Performance Metrics Collected Using AppOptics
Application Time-Series Key Performance Indicator (KPI) Metrics
This refers to metrics such as the number of requests per minute, the average response time, and error rates over time. Not just for the application but also services and transactions. And the reason they are referred to as Time series is that they are tracked over a certain period. By studying the changes that occur during this period then you can draw important performance insights.
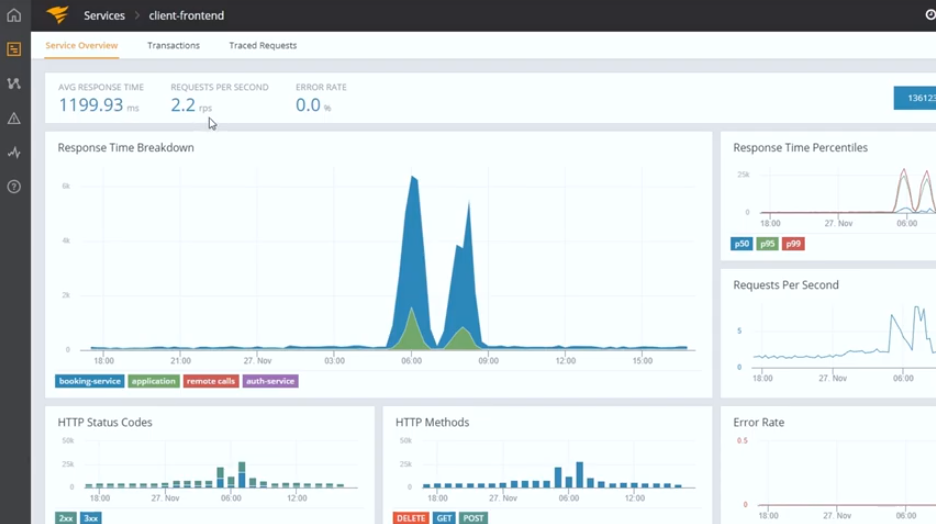
The cool thing is that these metrics are tracked in real-time so you can flag down problems as they occur. But even better, you can observe the trends to predict a potential problem and resolve it before it escalates to the end-user. This will also be useful in predicting future business needs and, therefore, help in planning for acquisition of new resources.
Infrastructure KPI Metrics
This is where you find the performance metrics of your infrastructure such as CPU load, Memory utilization and also disk and network I/O.
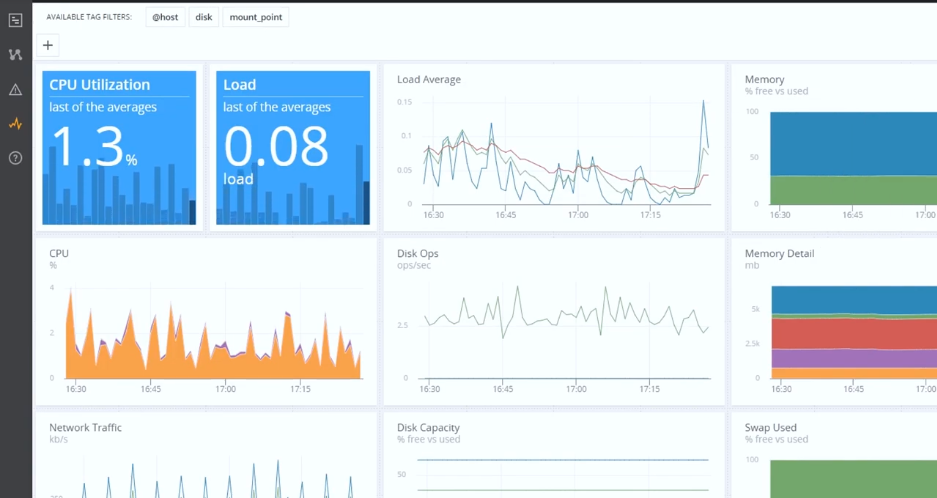
The application is not always the problem and these metrics will help you to prove that. They will also help you to identify the specific aspect of your infrastructure that is causing performance issues. Additionally, if you capture the infrastructure performance issues early enough, it will prevent them from reaching the application and thus ensure the best digital experience.
The SolarWinds Application Performance Monitoring (APM) Suite
Even on its own, AppOptics is a solid monitoring solution. However, in another genius move by SolarWinds, you can now integrate it with three other of their cloud-based SAAS tools to form a full suite solution. The SolarWinds APM Suite is perfectly suited for full-stack monitoring of hybrid and cloud environments. These are the other software included in the suite.
Pingdom – This is a solution for monitoring the application from the end user’s perspective. Pingdom will test your website to determine whether it is online and is performing normally. This facilitates quick troubleshooting and then you can use AppOptics to quickly find the root problem and resolve it.
Loggly and Papertrail – These two tools are responsible for log analysis and management. They allow you to move from the problem visualizations in the AppOptics software and view the various logs polled from your applications. Without Loggly and Papertrail it would take a lot of effort and time to find the particular log data that are relevant to the application problem. Also, through log analysis, you can spot anomalies that are indicative of potential problems and resolve them before they are a problem to the end-user.
Installation
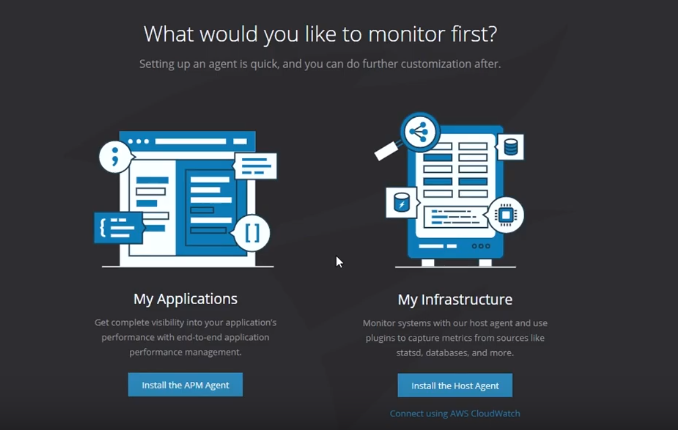
One of the best features of AppOptics is its ease of installation. The tool does not require any configuration and will integrate with just about any application you are using. The installation can be divided into two major steps. One involves the installation of the application agent while the second is the installation of the host agent for infrastructure monitoring.
Installing the APM Agent
The first step here will be to select the language that your application is running on. Then you will need to define your operating system and assign a name to your service.

From there you will be provided with the instructions on how to set up the host which involves executing a provided script in your preferred installation directory. Once the agent has been downloaded then you need to configure your Java Virtual Machine to accept the agent. Again the script for this task is provided so you just need to execute it. Once everything is complete restart the JVM to load the agent and it should connect to AppOptics almost immediately.
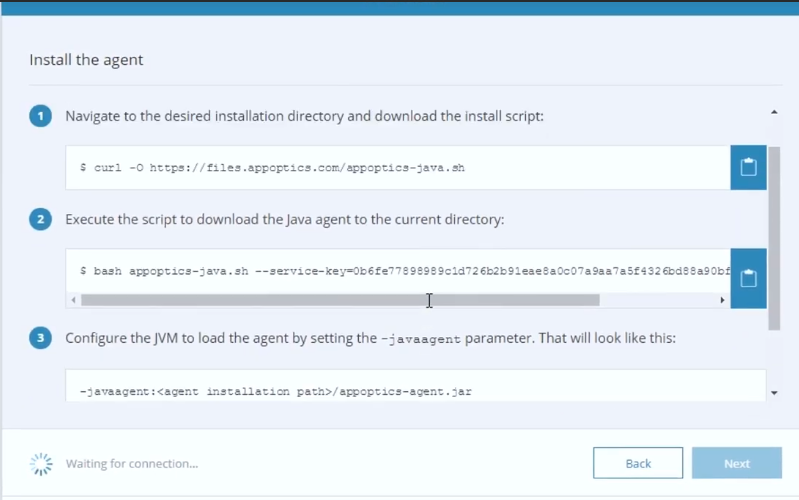
If your services have been created using different languages as is the case nowadays due to application distribution, then repeat the above process and select the appropriate language. AppOptics is compatible with 7 programming languages which are just about all the languages associated with the development of applications. This APM tool automatically discovers your applications, maps the associated services and will begin polling the performance metrics in about two minutes.
Installing the Infrastructure Agent
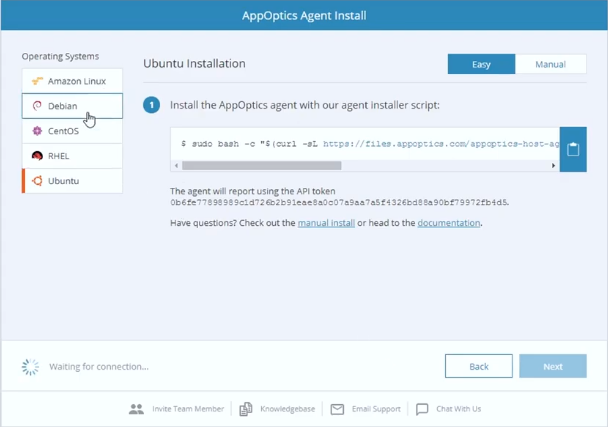
For this process, you need to go to the initial step and select the Install Host Agent option. Again you will be provided with the installer script which you need to execute in your preferred installation directory. Then, of course, you need to specify the monitoring environment.
What I Loved about AppOptics
User-Friendly
The first thing I noticed after installing AppOptics was how well it has been organized. All the services in your environment are listed on the home interface together with the individual dashboards for all the performance metrics that you will be monitoring. You will also be able to view all your active plugins and a list of alerts signifying potential problems that need your attention.
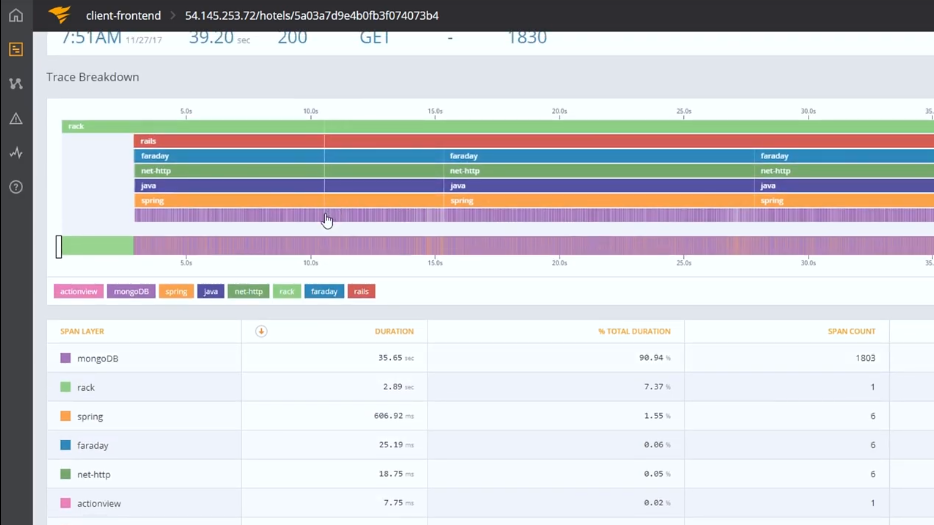
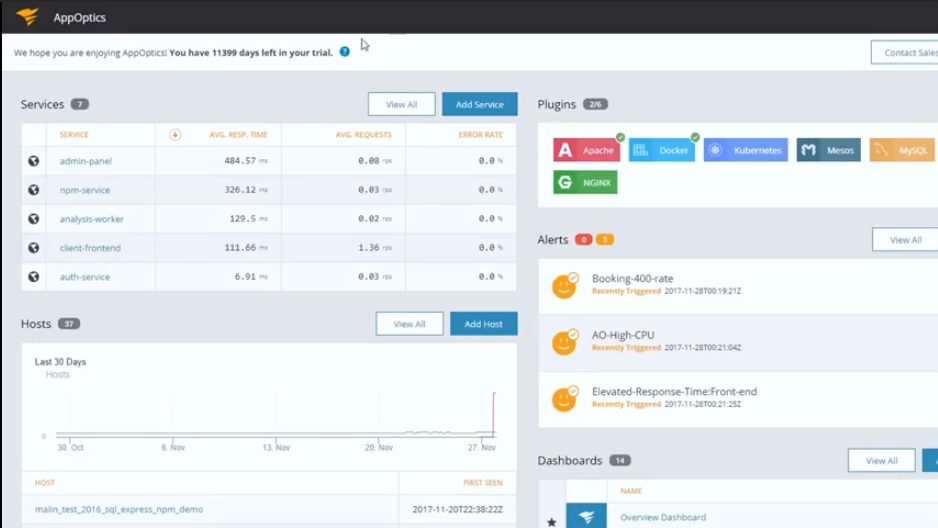 The performance metric dashboards give you an overview of the underlying issue. You can access more information about the problem by clicking on the dashboard. AppOptics also employs a really easy way to trace user requests through your stack and uses a heatmap to help you pinpoint the exact area in your application or infrastructure where a bottleneck is occurring. The simplified interface and accurate tracking techniques all serve towards decreasing the Mean Time To Repair (MTTR) and thus ensure the best user experience.
And unlike some of the other APM tools, AppOptics performs all these functions in the back-end without slowing down your applications. That would defeat its whole purpose of ensuring your apps best performance, right?
Customizable Dashboards
Another salient feature about this APM software is the ability to customize the dashboards which is important for two reasons. The first is that it allows you to create dashboards that display only the vital performance metrics of your applications. AppOptics cannot tell which services are the most crucial to your organization which means the default metrics it displays might not be what you are looking to monitor.
The other reason is that dashboard customization will allow you to combine multiple dashboards into one so that you don’t have to shift between them continuously. It also the perfect way to combine infrastructure metrics with application metrics for better comparison and correlation.
Highly Extensible
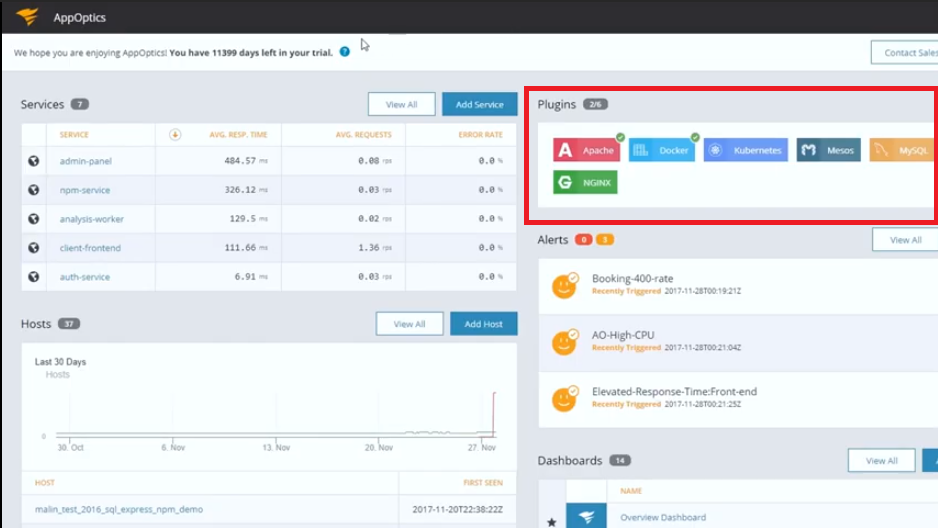
Right off the box, AppOptics can support more than 150 plugins. These include Kubernetes, Apache, MySQL, among others. You will also have access to additional integrations created by the members of the SolarWinds Online community that you can utilize to extend the software’s capabilities. And even better, you can create your plugins and additional metrics that are more suited to your application and the environment it is running in.
Live-Code profiling
This feature was incorporated into AppOptics in response to user feedback. And this is one thing that impresses me about SolarWinds. They have a high level of collaboration with their customers and are always adding new features to their products based on customer recommendations. This ensures that the product is always in tandem with the current trends.
Live-code profiling will particularly be useful to DevOps team as it allows them to determine the specific line of code that is causing a problem. AppOptics collects the most used functions and methods in a transaction and breaks them down providing important details such as the class, method, filename, and even line number.
Temporal Event Management
This is another important aspect of AppOptics that helps avoid inaccurate conclusions regarding your application’s performance. How? Well, there are those temporal events that are bound to happen in an IT environment and can lead to a performance issue with your application. Take, for instance, the deployment of a new service or a planned outage. AppOptics provides you with a way to associate such events to performance variations in your applications and differentiates them from other serious issues that need your attention. This will ensure that you don’t waste your time focusing on problems that will be gone once the planned event has been executed.
Alert Notifications
The ability to alert you when there is an issue in your IT environment is a feature that every monitoring tool should have. Otherwise, you would need to be on your toes every second so that you don’t miss important updates. AppOptics comes with multiple notification methods such as emails, dashboard visualizations, and it can also be integrated with other tools that enable you to open a ticket and assign it to the appropriate developer.
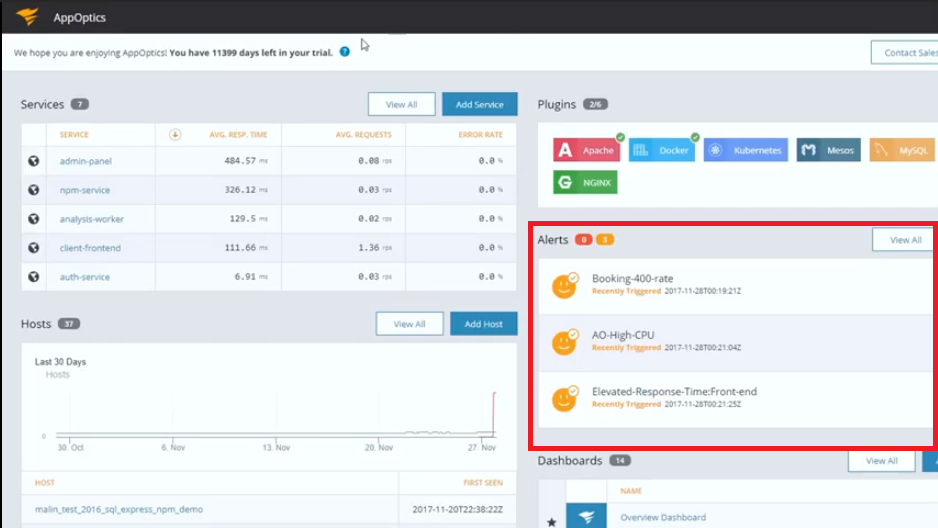
The customization of the alerts has been made simpler and now AppOptics can study your applications and come up with baseline performance. This can then be used as a reference for any customization you make and the action to be executed will depend on how the current performance is deviating from the baseline performance.
Conclusion
AppOptics is the swiss knife of Application Performance Monitoring. Not only does it monitor your infrastructure and application environments but also the data provided will be useful for DevOps, Operations and the business leaders. This tool makes it possible for the operations team to find and solve issues in your applications without having to involve the development team.
By merging Librato and Traceview, SolarWinds went out of their way to ensure that they are bringing out a product that can cope up with the complexity and increased distribution of the modern-day applications. And that move to allow integration with the three other tools we mentioned (Pingdom, Loggly, Papertrail). Well, for me that is what cements AppOptics as the real powerhouse when it comes to Application Performance Monitoring.
