The 5 Best Traceroute Alternatives for Connection Path Analysis
Traceroute is a popular but very basic diagnostic tool that helps you track an ICMP data packet from one network host to another. When a computer is communicating with other devices on a network, the communication data must first be sent through a number of small networks otherwise referred to as hops before reaching its target device. Of course, the average user is not aware of this but as a network admin, it’s important you know the exact route taken by the data. This will help you determine why a device or web-server is unreachable and the additional data collected will help fix network delays.
For a tool that was developed in 1987 and has not received any major upgrade since then, it’s easy to see why Traceroute would not fit in the modern networks and hybrid IT environment. One big limitation of Traceroute is that it only gives insights for one way. That is from the source to the destination. This, therefore, means that the data collected can be inaccurate since it’s possible that connection delays are happening as the data moves back from the destination back to the source computer.
Some people may also have a problem with the use of a command line interface. Note that some of the alternatives we will be listing also use a command line interface but we have also included some great alternatives that come with a Graphical User Interface. The good thing with GUI tools is that they involve simple mouse clicks instead of having to type in commands. They also tend to have a better display of the path analysis data which is all great for beginners.
Now, there is one question I have come across a number of times that I feel it’s important we address. What’s the difference between Traceroute and Ping? And to fully explain that I will first need to explain how Traceroute works.
How does Traceroute Work?
This tool functions by assigning what we call Time To Live (TTL) value on the data being sent. The TTL represents the number of hops the packet of data can make and begins from 1 and is gradually increased until it reaches the destination device.
So for instance, if there are 5 hops between the source and the destination host, the first packet with a TTL value of 1 is sent. The first router will receive the packet decrement the value to zero and then send a ‘Time exceeded’ error message back to the source computer. The computer then uses this information to identify the router on the first hop and then sends another packet with a TTL value of 2. Again this will be decremented to zero after it reaches the second hop and an error message is sent back to the source computer. This process is repeated until the packet data finally reaches the target host and at the end of it all, you will have a list of all the routers along the path from the source to the destination. Traceroute also records the time taken for the data to reach each router which helps to identify exactly where the latency is coming from.
Compare that to a ping which involves sending an ICMP echo request to a target IP address and waiting for a reply and you already have the answer to our question.
What’s the Difference between Traceroute and Ping
Ping is primarily used to determine whether a network host is available and the amount of latency in your network. Traceroute on the other follows the exact path taken by the packet data and will, therefore, pinpoint where exactly the connection problem is coming from. A ping is significantly faster than traceroute and can be replied to in milliseconds. In essence, you use a ping when you want to establish whether a network device is up or down. Once you have established it’s down, then you use a traceroute to identify where the problem is.
With that out of the way let’s now look at 5 tools and software you can use instead of Traceroute.
1. Traceroute NG
When it comes to Network Management and Monitoring software, SolarWinds are always outdoing themselves. The Network Performance Monitor (NPM) was their flagship product and it cemented their names as industry leaders. In fact, the NPM can be used to perform hop by hop analysis of data. However, it’s not the perfect alternative to Traceroute because of its price point. The NPM is a full-suite network monitor and therefore comes at a price.
So instead we will be looking at the SolarWinds Traceroute NG. It is a completely free tool that comes with a number of extra features on top of data path analysis.
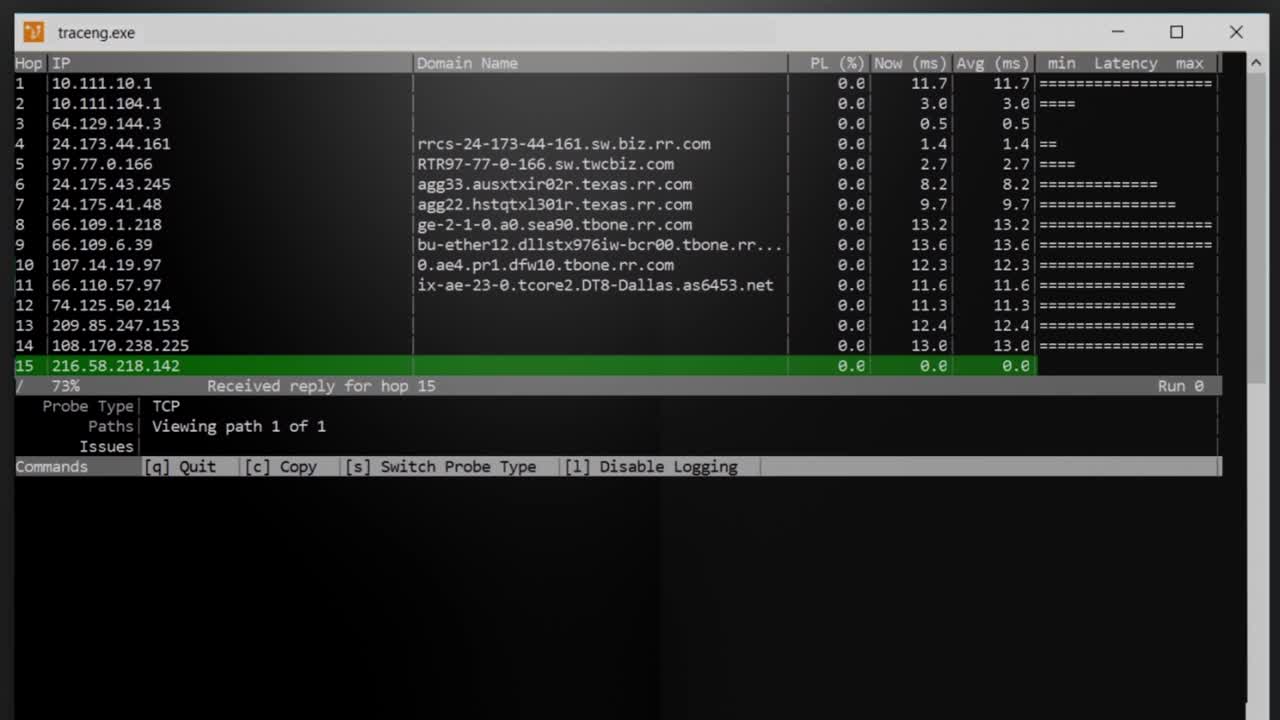
For instance, Traceroute NG is equipped with a built-in logging function and also allows you to copy the analysis data to the clipboard and consequently paste it somewhere else like in a CSV file. This is an upgrade over Tracert that is only limited to taking screenshots of the data. The tool also collects useful data such as the time between each hop, IP addresses for all the devices, the Fully Qualified Domain Name (FQDN), the percentage loss of packet data among others.
Traceroute NG is similar to the native Tracert in that it uses a command line interface. But this is a good thing because it won’t take you long to adjust to the shift. The other great feature about this tool is that it performs continuous probing. This means it will continuously be analyzing the network path data and in case of any path changes, you will be notified.
Like all the other SolarWinds product, Traceroute NG performs automatic discovery of your Network. It uses TCP and ICMP standards to trace data paths and can penetrate through most firewalls. Traceroute NG is compatible with both IPv4 and IPv6 and only works for Windows systems.
2. MTR Traceroute
MTR is also a command line network diagnostic tool but one that combines both ping and traceroute. This means you will be able to easily determine the availability of a network host and consequently pinpoint the exact problem by performing hop by hop analysis of the data path. MTR uses ICMP echo requests to derive the performance data on each hop but it can also operate on UDP mode.
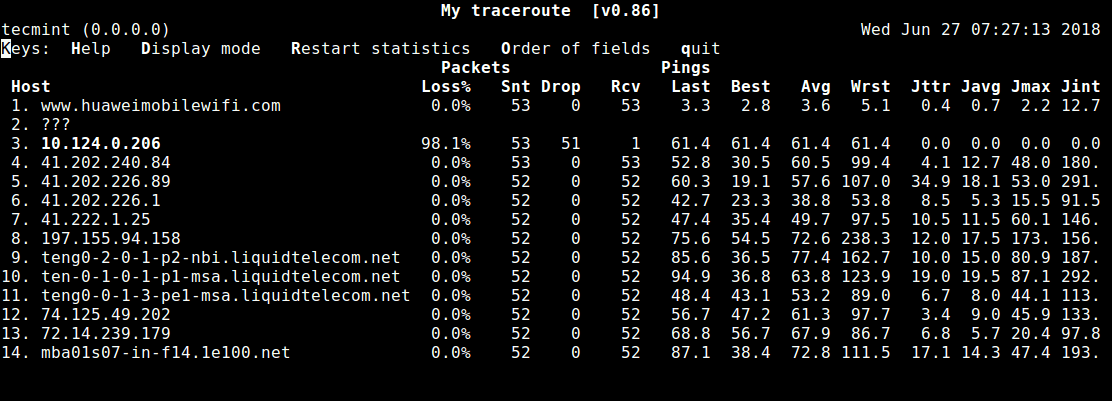
This tool can also be used to establish packet loss and network jitter. The performance data is presented in a tabular view for easy understanding. And unlike the native Traceroute, MTR also supports IPv6 addresses.
MTR also performs continuous path scans which means that the network performance data is always being updated. This is definitely better than having to manually execute the scans every time you want to check if there are any changes in the network performance metrics.
MTR is designed for Unix systems by default but it allows you to use Autoconf to configure it so that it can work on a different system. Autoconf scans the target system and then generates header files and a makefile from existing templates. These are then added to the MTR source code to make it installable on the said system. This is true even for Mac OS.
3. Open Visual Traceroute
Open Visual Traceroute is an open source traceroute software that can be used on multiple operating systems including Windows, Linux, and Mac OS. Unlike the other two tools we have reviewed, OVT uses a graphical interface. Its highlight feature is the 3D representation of the data path on the world map. Once the traceroute is complete you can zoom and spin the map around to view all the locations where your data went through. And if your computer is having problems using the 3D visualization you can make use of the 2D maps.
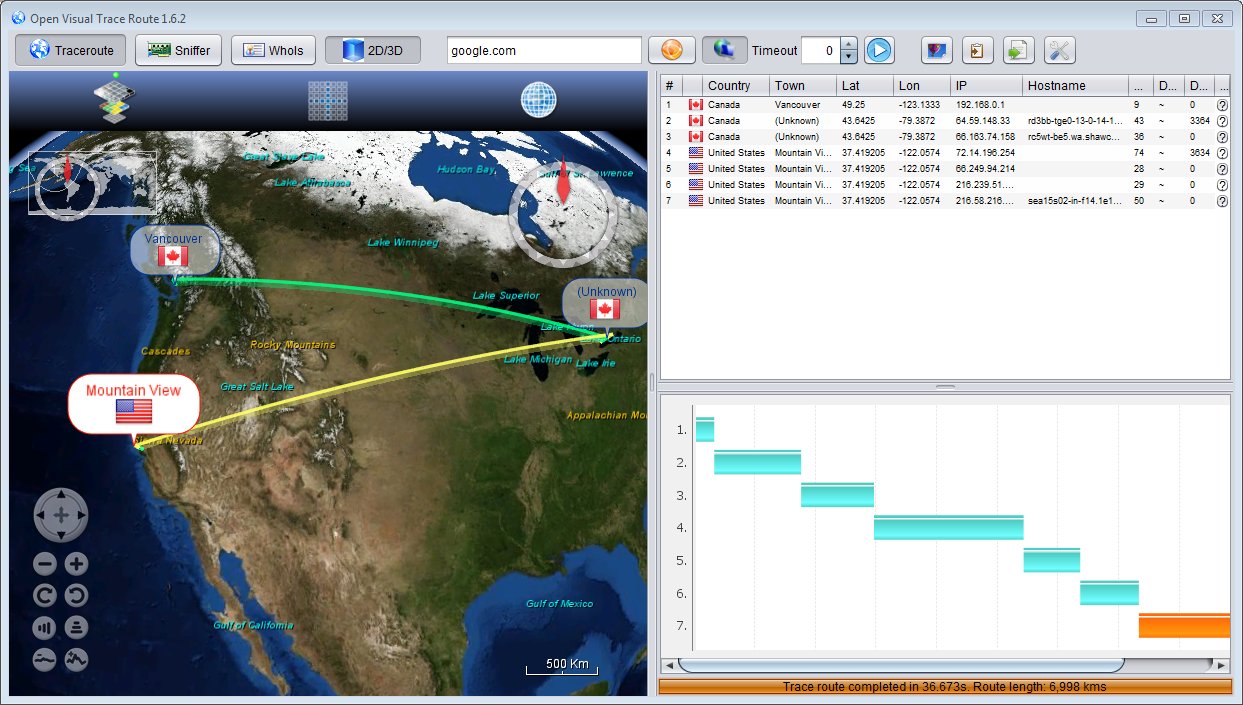
Open Visual Traceroute also provides you with a tabular view of all the data that you are interested in when executing a traceroute. These include the hostname and location, network latency, DNS lookup time and distance between the various nodes. It does not come with a built-in logging functionality but it allows you to copy the analysis data and save it in a CSV file. You can also take screenshots.
It’s also important to note that this tool is more than just a traceroute tool. It comes with additional features such as the packet sniffer which gives you a clear overview of the type of data being transmitted from the source to the destination servers. It also has a ‘Who Is’ feature that you can use to easily access all the public information about a particular domain.
4. Path Analyzer Pro
Path Analyzer Pro is also an excellent recommendation if you are not big on Command Line Interface tools thanks to its user-friendly GUI. But the highlight feature is the advanced path discovery engine that makes the tool considerably faster than the native traceroute software. According to the developers, Path Analyzer Pro is 20x faster.
Other features that distinguish it from the traditional traceroute is the detection and traversal of firewalls, the analysis of multiple performance metrics for every hop and stunning graphical visualizations. The latter will be essential in creating a better understanding of your network problems.
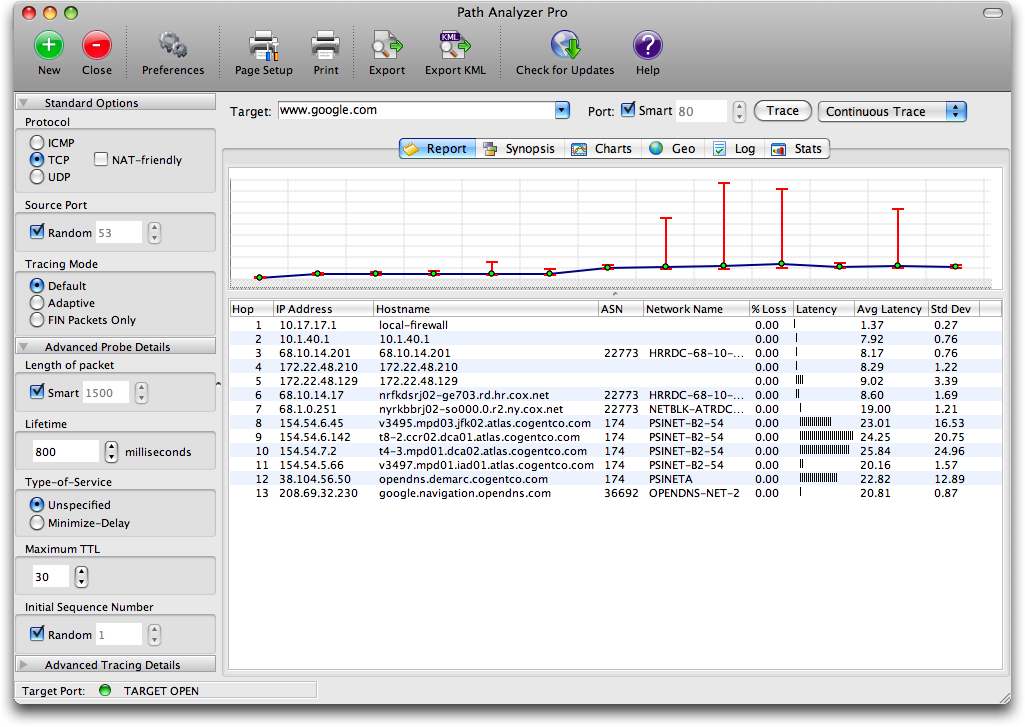
Path Analyzer Pro also allows you to generate, print and export reports which can help when you want to store the performance data for future reference or simply share the data with the management and other admins.
Similar to Open Visual, this tool has a map tool that gives you a great overview of the location of the IP addresses you are probing. You can zoom and pan the map for a better view. It also has a ‘Who Is’ feature which helps you collect information about a particular domain.
Additional features include DNS and Address resolution and email address tracing which could be useful in establishing the source of your emails. This can help you unmask spammers or people sending threatening messages.
5. Visual Route
The last tool on our list is Visual Route which is an excellent tool to perform hop by hop path analysis. It also collects additional performance data such as packet loss and response time. However, the highlight feature of Visual Route is the ability to reverse trace the data packet and thus overcoming one of the major shortcomings of the original Traceroute. It executes this by creating remote agents on the destination which facilitate the backward tracing. Also related is the reverse DNS lookup that allows you to deduce an IP address from a domain name.
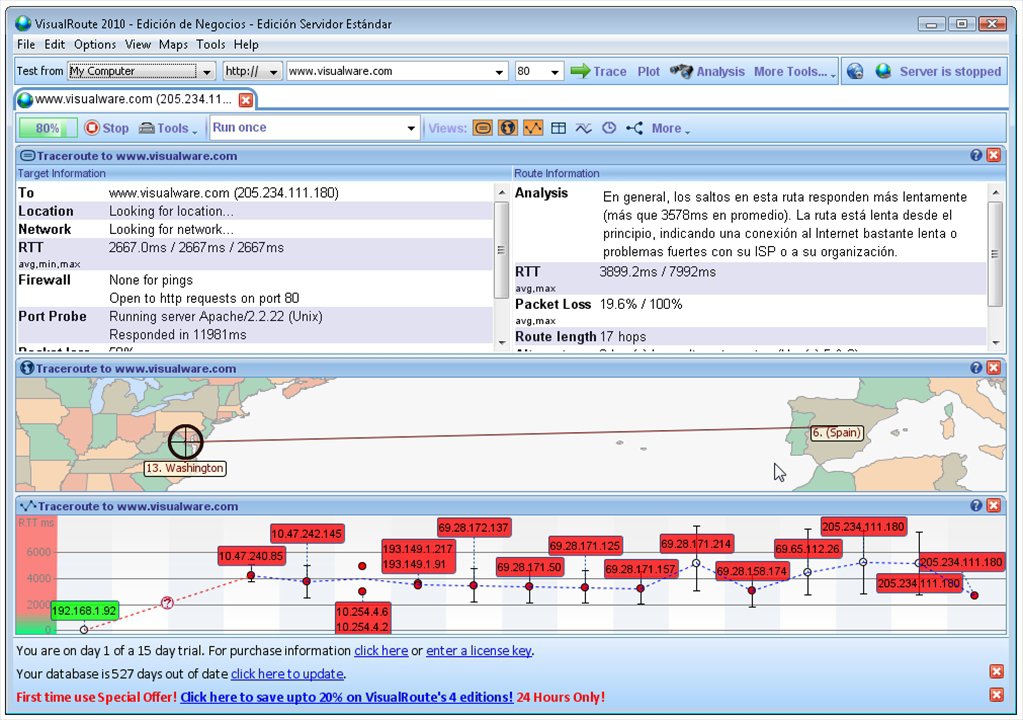
Visual Route also stores historical data which can help quickly diagnose present problems by comparing it with the past data. The tool also performs continuous path analysis while continuously logging the performance data which gives rich insights into the performance degradation occurring over time.
This tool combines path tracing with IP location reporting to give you the physical geographical location of the servers and routers which is essential in understanding your routing problems.
Visual Route also has ping functionalities that it further enhances by including ping plotting. It maps the network response time against a time period to help you quickly diagnose a problem. So then you spend less time troubleshooting and consequently put more time in the problem resolution. The tool is available for Windows and Mac Systems.


