How to Switch Axes on a Scatter Chart in Excel
Microsoft Excel is quite possibly the best spreadsheet application ever designed for the Windows Operating System. Excel is incredibly feature-rich, and just one of the many features Excel has to offer to users is the ability to create scatter charts. A scatter chart, also known as a scattergram or scatter graph, is a mathematical diagram that can be used to display values for two variables using Cartesian coordinates on a graph. Scatter charts are incredibly useful tools, especially for any user who needs to display the results of two different values of two different variables in the same place.
Creating a scatter chart on Excel is pretty straightforward – all you need to do is create a column with the coordinates for the graph’s X-axis and a column with the coordinates for the graph’s Y-axis, feed the raw data to the Excel and the absolute wizard that the application is, it will process the data, create a scatter chart and plot the coordinates you fed it onto the scatter chart. Like all graphs, a scatter chart has an X-axis and a Y-axis. Sometimes, Excel users, for various different reasons, need to switch a scatter chart’s axes with one another – meaning they want to change the X-axis values in order for them to be plotted on the Y-axis and the values currently on the Y-axis to be plotted on the X-axis.
While it might sound confusing and a bit complicated, it is not – switching the X-axis of a scatter chart with its Y-axis and vice versa on an Excel spreadsheet is quite easy. The following are the two different methods you can use to switch the axes of a scatter chart in Excel:
Method 1: Use the Switch Row/Column option
Microsoft Excel has a Switch Row/Column that has a few different uses, one of them being switching the axes or charts and graphs such as the average scatter chart. Even though this method’s success rate with scatter charts isn’t all that high, it is still a method worth trying. To try and switch the axes of a scatter chart using this method, you need to:
- Click anywhere on the scatter chart you watch to switch the axes to select it.
- You should now see three new tabs in Excel – Design, Layout, and Format. Navigate to the Design tab.
- In the Data section, locate and click on the Switch Row/Column button to have Excel switch the axes of the selected chart.
Method 2: Swap the values for each axis with one another
If Excel’s Switch Row/Column option doesn’t work for you, fear not – it isn’t the end of the world (at least not yet). You can still switch the axes of the target scatter chart by manually swapping the coordinates of the graph’s X-axis for the coordinates of the graph’s Y-axis and swapping the coordinates of the graph’s Y-axis for the coordinates of the graph’s X-axis. Manually swapping the coordinates for each of the chart’s axes with each other is bound to get Excel to switch the axes of the scatter chart. If you would like to switch the axes of a scatter chart in Excel using this method, simply:
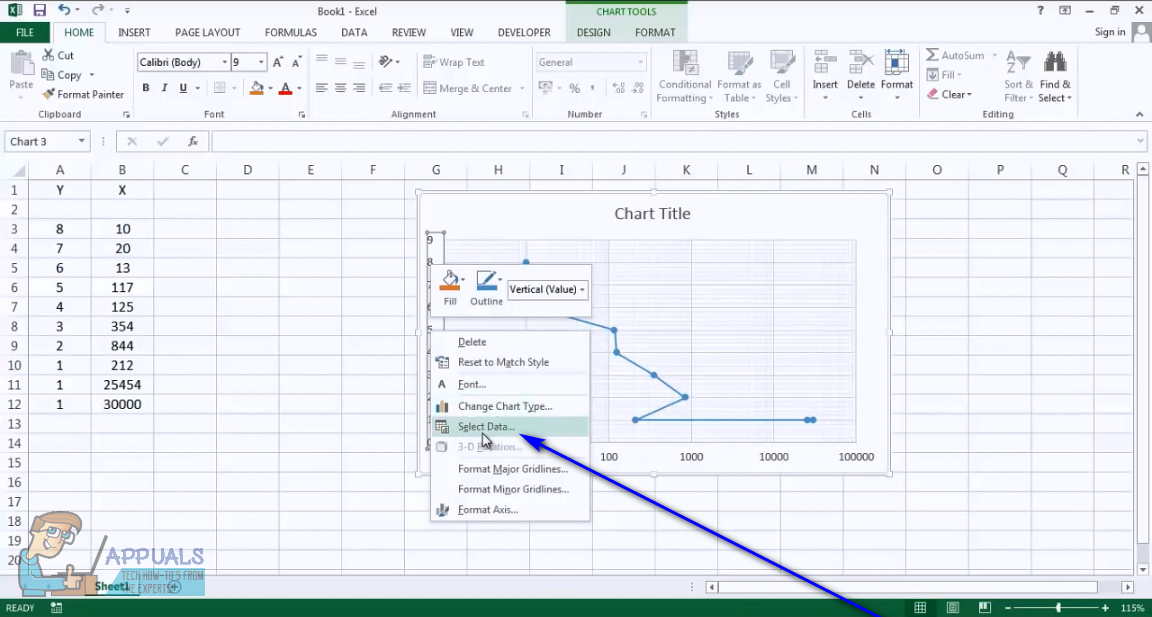
- Right-click on either the X-axis of the scatter chart or its Y axis, doesn’t really matter which one.
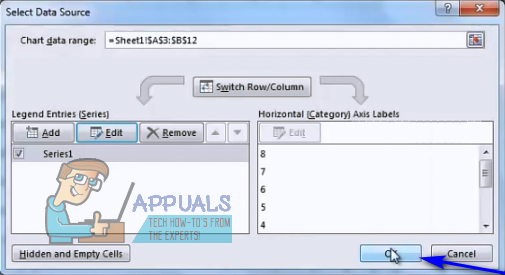
- Click on Select Data… in the resulting context menu.
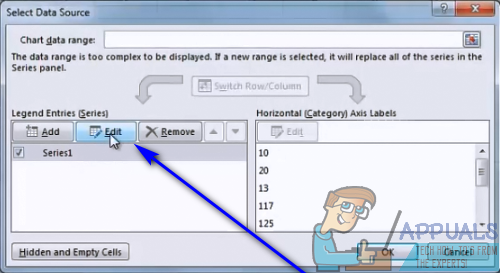
- Click on Edit in the Select Data Source window that opens up.
- Replace whatever is in the Series X values: field with whatever is in the Series Y values: field, and replace whatever is in the Series Y values: field with whatever is in the Series X values field.
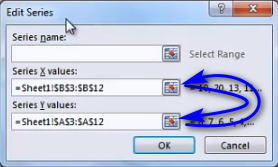
- Click on OK.
- Click on OK once again in the Select Data Source window.
As soon as you click on OK, the axes of the selected scatter chart will be reversed and Excel will re-plot the scatter chart to reflect the change.
HOW CAN I DISPLAY THREE LOAD VS. DISPLACEMENT CURVES OVERLAID ON A SINGLE CHART IN EXCEL?