How to Analyze DUMP (DMP) Files on Windows 8 and 10
A BSOD (Blue Screen of Death) is the name given to the blue screen that appears when a computer running on a version of the Windows Operating System crashes and shuts down abruptly. The cause of a BSOD is described by the blue screen itself, but seeing as though the blue screen is only visible for a couple of seconds before the computer either shuts down completely or reboots, analyzing the entire BSOD right then and there is impossible.
Thankfully, though, whenever a rightly configured Windows computer crashes and displays a BSOD, it creates a dump (.dmp) file containing the particulars of the BSOD. The .dmp files that Windows creates, however, are in computer language and need to be converted into a human-comprehendible format before they can be analyzed. WinDBG (Windows DeBuGger) is a software utility created by Microsoft that is capable of loading and presenting the .dmp files that Windows computers create when they BSOD to users for analysis. However, in order to use WinDBG for the analysis of BSODs, you are going to have to appropriately set it up, and that is exactly what this guide is here to teach you to do.
Stage 1: Making sure you have the right version of the .NET Framework
In order to work the way it is supposed to, WinDBG requires none other than version 4.5.2 of Microsoft .NET Framework. If you have any other version of the .NET Framework installed on the computer you want to analyze .dmp files on, download .NET Framework 4.5.2 from here and then install it before moving onto downloading, installing and setting up WinDBG.
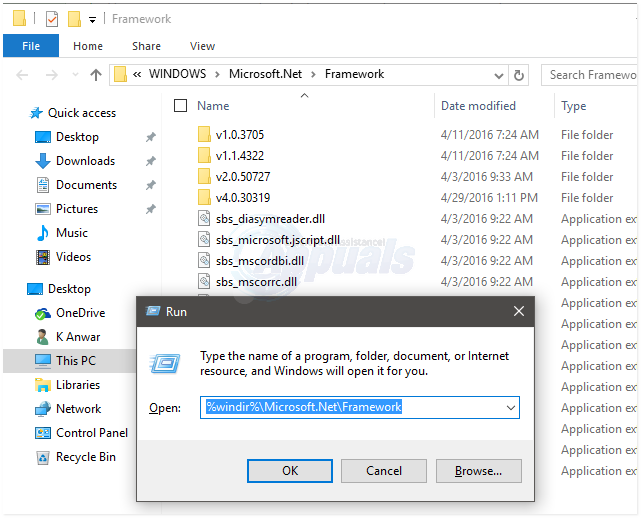
To check which version of .NET Framework you have, Hold the Windows Key and Press R. In the run dialog, type
%windir%\Microsoft.NET\Framework\
You will see the folder with the version. If it shows a folder with “4.0.etc” then you are most likely already having the 4.5 version of .NET Framework.
Stage 2: Downloading and installing WinDBG
Click here to begin downloading the WinDBG
Once the WinDBG installer (a file named sdksetup.exe by default) has been downloaded, navigate to and double-click on it to launch it.
Specify a custom installation location for WinDBG or simply use the pre-configured default installation location.
Accept the WinDBG license agreement.
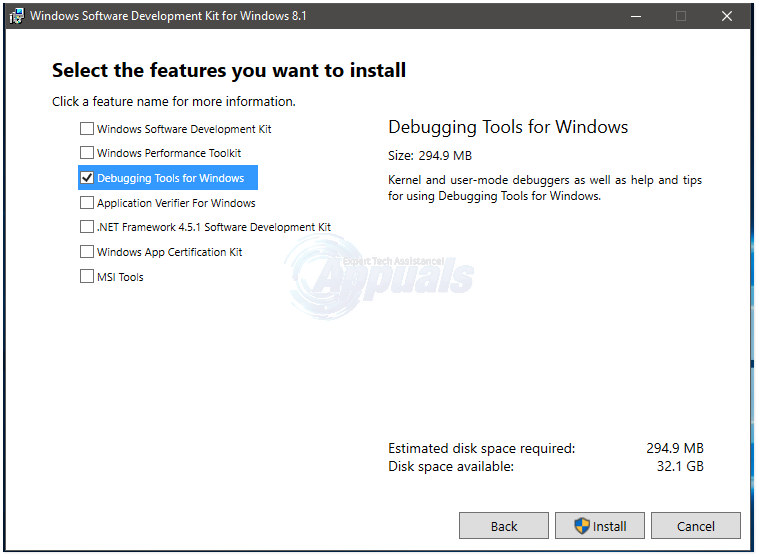
On the Select the features you want to install screen, select only the Debugging Tools for Windows feature and click on Install to initiate the installation.
Wait for WinDBG and its selected feature to be downloaded and installed on your computer.
Stage 3: Associating .dmp files with WinDBG
In order for you to be able to read and analyze the .dmp files your computer creates, you need to first associate .dmp files with WinDBG. In order to do so, you need to:
If you are using Windows 8 or later, right-click on the Start Menu to open the WinX Menu and click on Command Prompt (Admin). If you are using an older version of Windows, open the Start Menu, search for “cmd”, right-click on the search result named cmd and click on Run as administrator. This will launch an elevated Command Prompt.
Type the following into the elevated Command Prompt and press Enter:
cd c:\Program Files (x86)\Windows Kits\8.1\Debuggers\x64
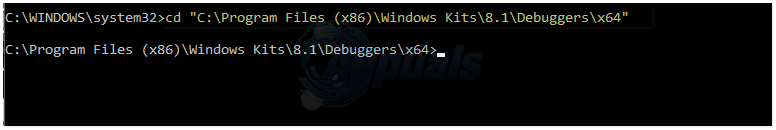
Note: If the installation location for your instance of WinDBG is different, replace everything in front of cd in the command line above with the actual installation location of WinDBG in your case.
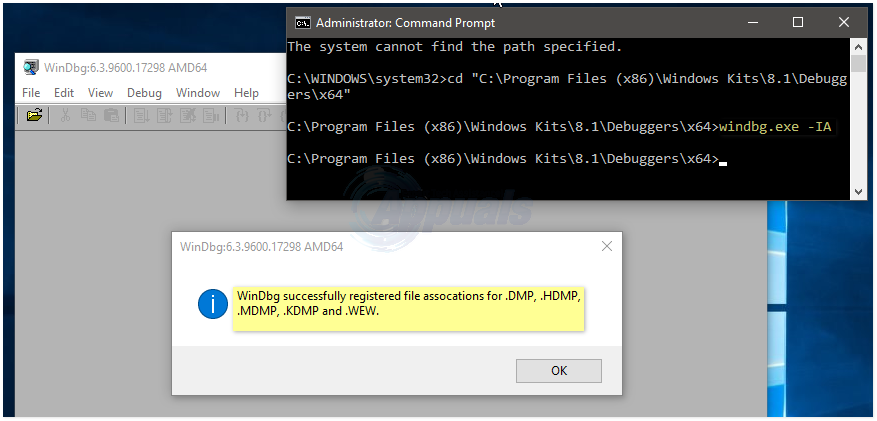
Next, type the following into the elevated Command Prompt and press Enter:
windbg.exe -IA
If all went well, a new WinDBG window containing a dialog box confirming the association of your computer’s .dmp files with WinDBG will appear. If such a confirmation box appears, you can go ahead and close both WinDBG and the elevated Command Prompt.
Stage 4: Configuring the Symbol Path for WinDBG
In order to read the binaries in a .dmp file, WinDBG uses symbols which it needs to have on hand whenever you require it to read and analyze a .dmp file. The symbol path is the directory on your computer where WinDBG stores all of its downloaded symbols. While you are free to turn any location on your computer’s hard drive into the symbol path for your installation of WinDBG, this is an extremely crucial and fragile stage, which is why it is recommended that you simply use the default location (the same one used in this guide). Here’s how you can configure the symbol path for WinDBG:
Launch a new WinDBG window by opening the Start Menu and clicking on All Programs > Windows Kits > Debugging Tools for x64 > WinDBG (x64).
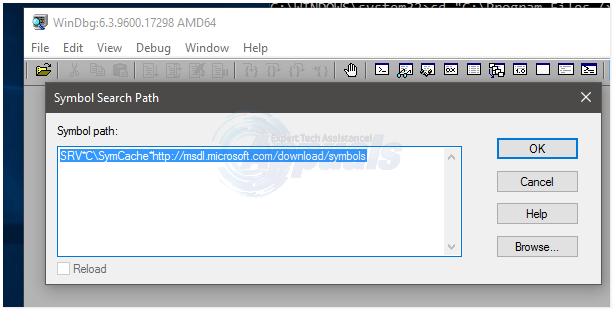
When WinDBG launches, click on File > Symbol File Path.
Type the following into the Symbol Search Path box and click on OK:
SRV*C:\SymCache*http://msdl.microsoft.com/download/symbols
This will instruct WinDBG to create a new folder named SymCache in Local Disk C and download new symbols and save them to this folder. You can replace C:\SymCache in the text above with any directory of your choosing where you wish to have WinDBG store its symbols.
Click on File > Save WorkSpace. This will save the new Symbol Path that you have configured.
Close WinDBG by clicking on File > Exit.
Stage 5: Testing your WinDBG installation
Once you have downloaded, installed and appropriately setup WinDBG, all there is left for you to do is to take your installation of WinDBG out for a spin and see whether or not it works as it is supposed to. To test your installation of WinDBG, you need to:
Download this .ZIP file.
Extract the downloaded .ZIP file to a new folder and double-click on the .dmp file among its contents to instruct WinDBG to start reading and displaying it.
A new instance of WinDBG will open automatically and you will see text appearing in the workspace. This is the first .dmp file that WinDBG is analyzing on your system, so it may take a significant amount of time as WinDBG will be downloading symbols and saving them to the Symbol Path you configured as it translates the .dmp file being used to test it. The next time you use WinDBG to analyze a .dmp file, it will not take as much time as it is taking with this one.
When WinDBG is done analyzing and translating the test .dmp file, the output will look like this:
The probably caused by line indicates what triggered the BSOD.
Followup: MachineOwner
The text at the end which is in bold shows up as soon as a .dmp file has been read and analyzed completely. Once this text shows up, the .dmp file will have been read completely, you will know that your installation of WinDBG works and you can move onto analyzing as many other .dmp files as you want. You can now exit WinDBG by clicking on File > Exit.
cant install test dmp file