How to add error bars in Google Sheets?
Google Sheets is a spreadsheet program which is part of a free web-based software package which comes with Google Drive. Along with a spreadsheet, there is also a word processor and a presentation program. These applications are also available in several platforms including Windows, MAC, Android, iOS, Windows, Blackberry etc. The suite is also with a version control where each user can track the changes in a shared file.

Like Excel of Office, Sheets also have the feature of displaying error bars in a document. Error bars are graphical representations of the variability of data and are used to indicate the error or uncertainties of reported measurements. This gives the user an idea of how precise the measurement is.
How to add error bars in Google Sheets?
In order to add error bars against your data in Sheets, you should first make sure that you have complete measurements and the error against each one. This step is necessary as error bars can only be represented if there are proper X and Y axis.
If you do not have Error values, you can also use a standard percentage against your graph. It all depends on your work/project.
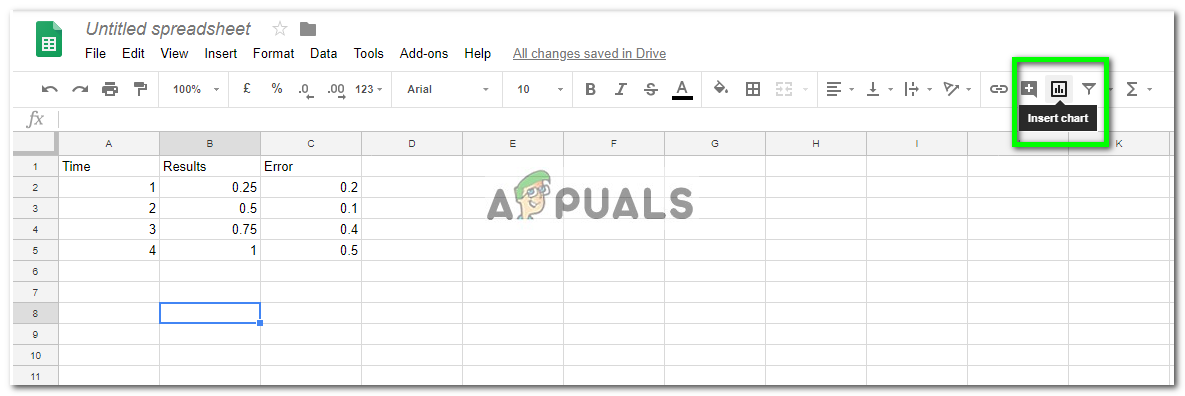
- Make sure that you have correct data inserted in Sheets. Select a blank cell and click Insert chart from the navigation bar at the top of the sheet.
- Now a new blank chart will pop up with no values selected. Click on the X axis using the right navigation bar and select the cells which you want to use for the X axis. You can easily select cells from your mouse. Press OK when done.

- Now select Series accordingly one by one. Click the icon once, select the cell; carry on like this until you have assigned all the series accordingly. You can also select using bulk-selection.
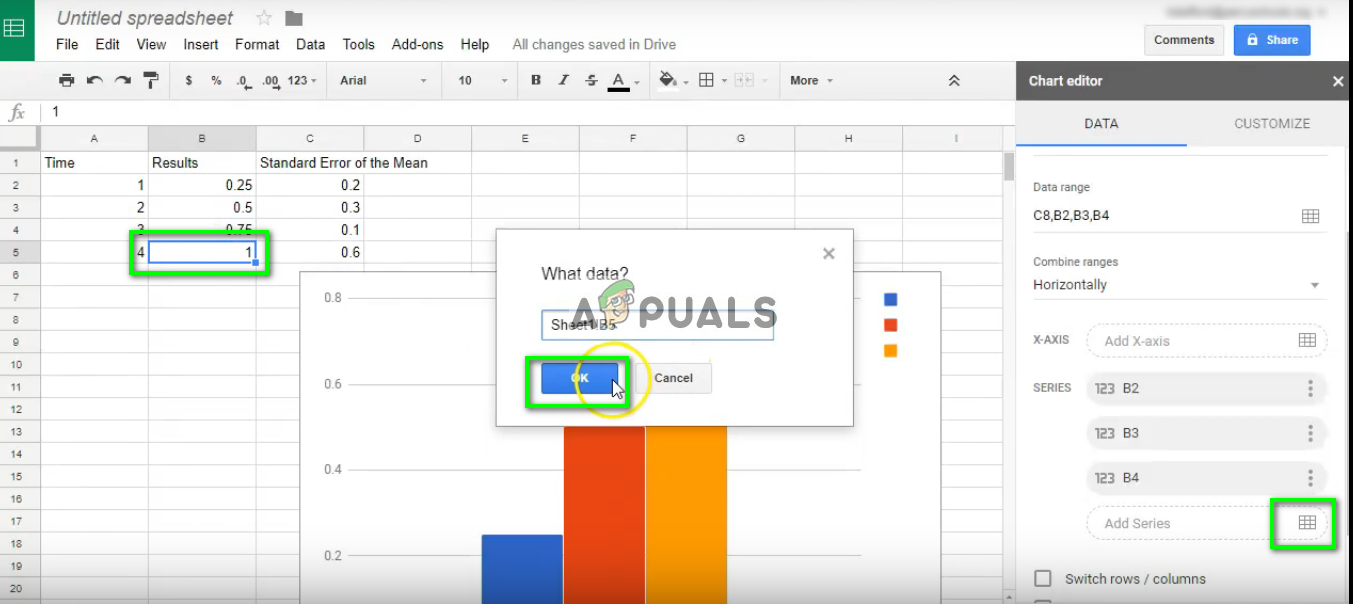
A good way to determine if you have inserted the values correctly is to see if there are different colors in the chart. If they aren’t, you can try inserting the data again correctly.
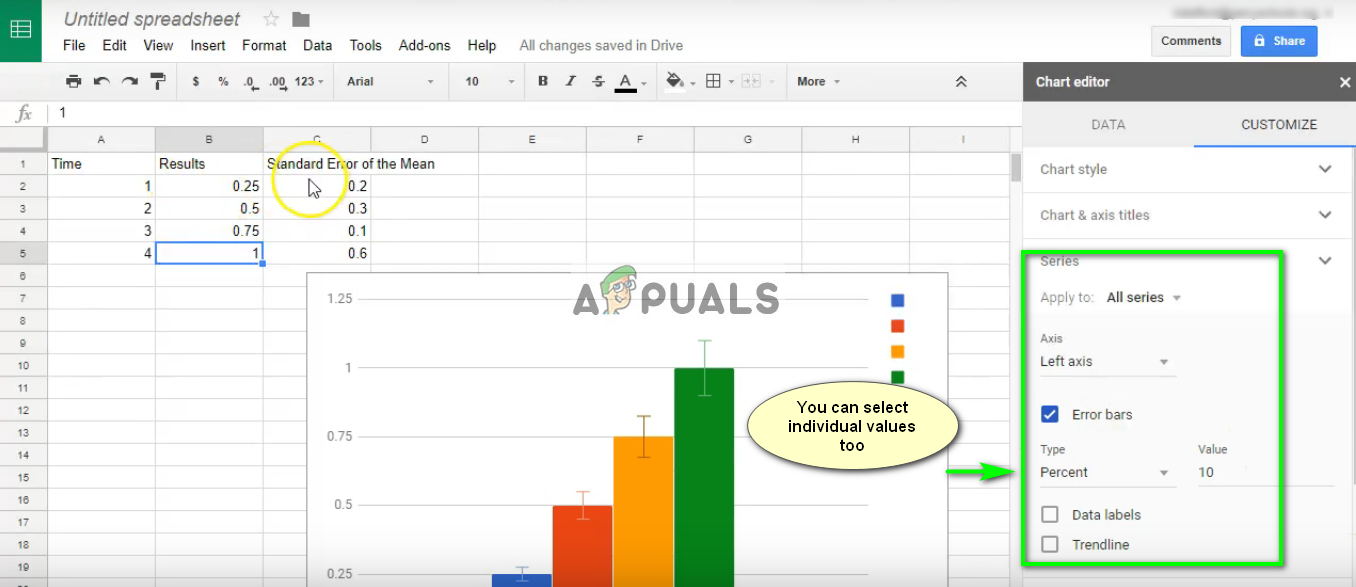
- Now select the tab Customize using the right navigation bar and expand series. Check the box Error bars and choose whether you want to choose a percentage or an absolute value using the drop down given.
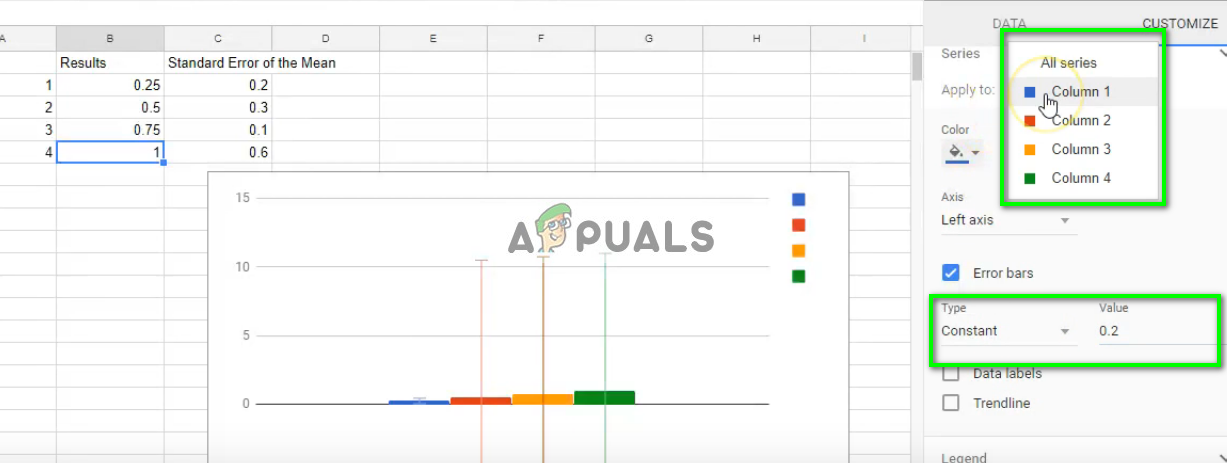
- For setting static values, you can expand Apply to: and select the column to which you want to apply the static value. Down below, you can expand Type and select Constant. In front of it, you can assign it a value.
- After implementing the changes, save your work. After expanding your graph, you will be able to see the error bars clearly. If you are having issues changing the options or loading some functionality, make sure that you have an active internet connection and the page is loaded correctly.