How to Make a Timeline on MS Word?
A timeline is used as a graphical representation of period or a time related history that you want to display in your work but in a graph so that it is self-explanatory. Microsoft Word gives you an amazing feature which allows you to make a timeline on your Word document with a lot of ease.
Timelines are mostly used when you have to show in order how certain events took place and according to the years or eras. Such time/year/period related data can be represented best through such graphs which are in the form of ‘Timelines’.
If you want to make a timeline on MS Word, here is what you need to do.
- Locate the Insert Tab on your MS Word. Look at the following picture to know where exactly it is.
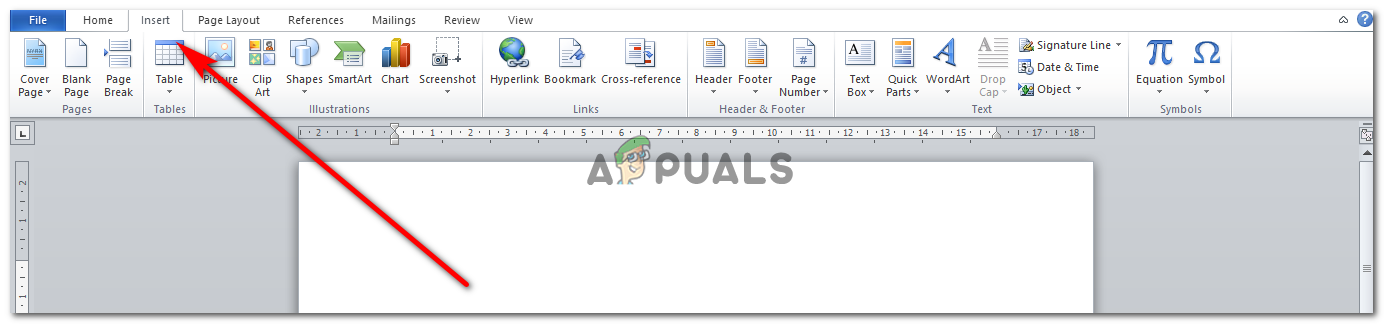 Find ‘Insert’ to make a timeline representation.
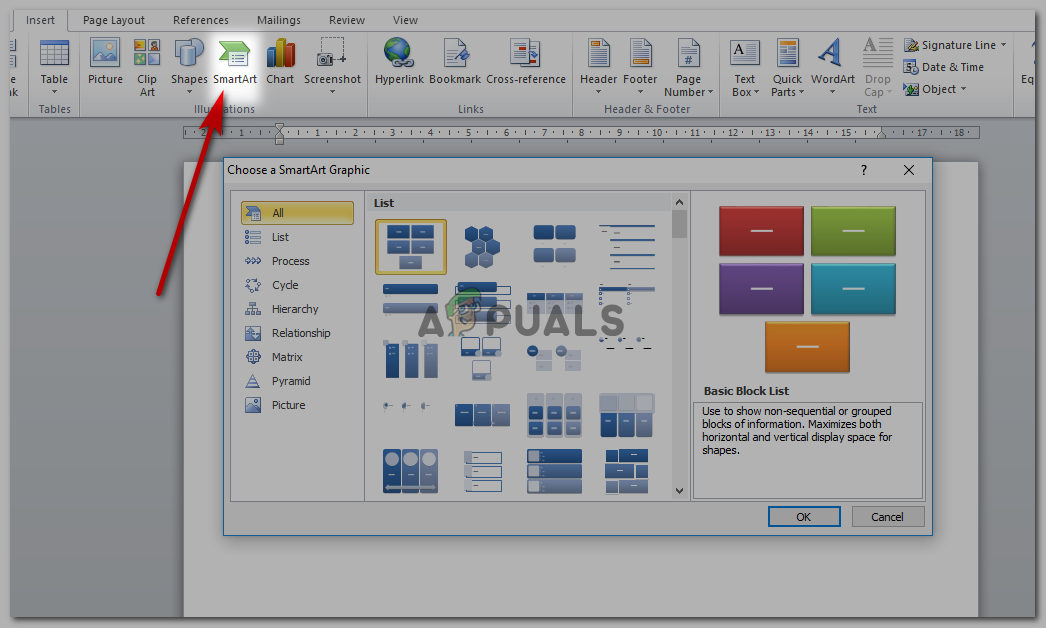
 - Next, click on ‘Smart Art’ which is right next to shapes on the same tools options. Clicking on ‘Smart Art’ will bring you the following options to choose from.
Smart Art - Since you have to make a timeline, you are going to opt for the tab ‘Process’, as shown in the picture below. Process will further bring to you more options of graphical representations which you can select depending on what style you want your graph to be in. I have chosen ‘Continuous Block Process’.
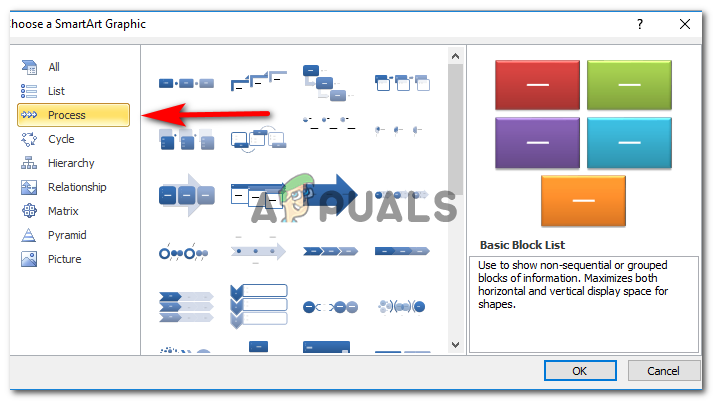
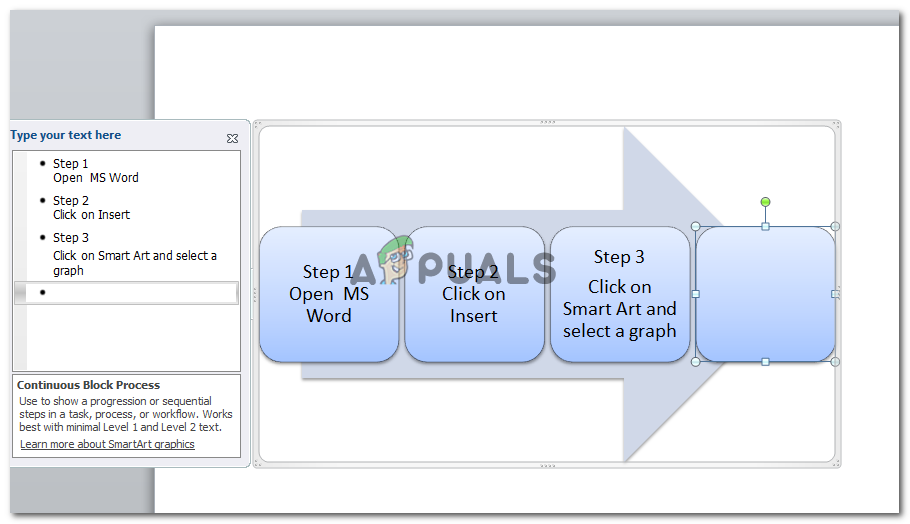
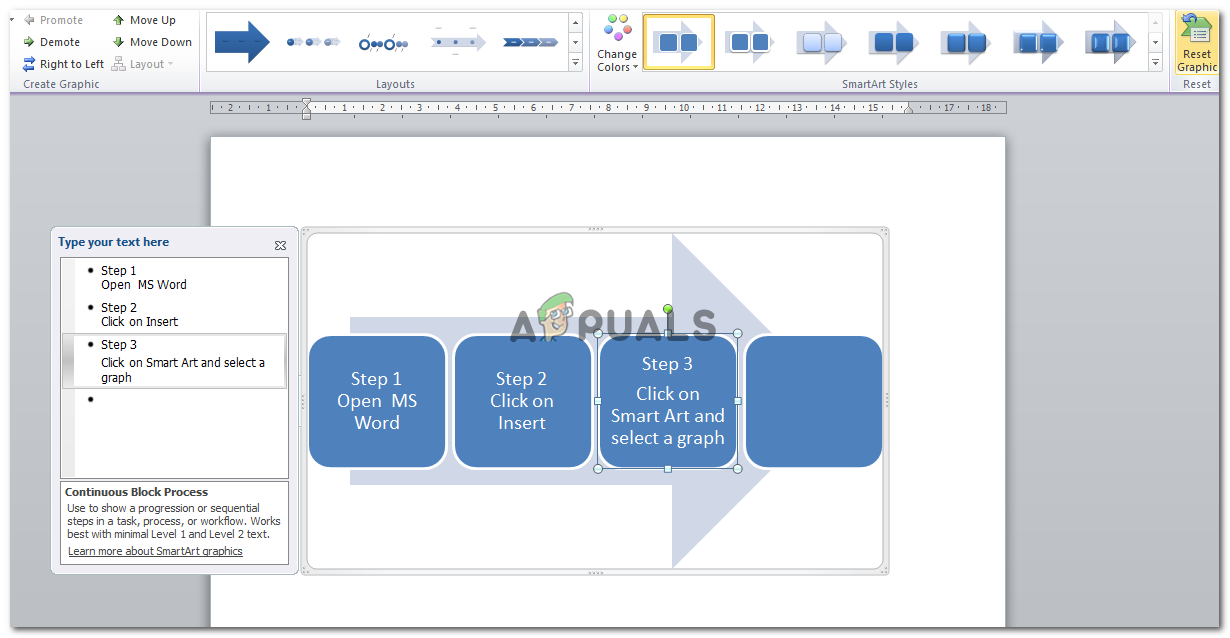
‘Process’ is your choice when you have to make a timeline regarding anything. - Once I clicked Continuous Block Process, this is how the graph appeared on the screen.
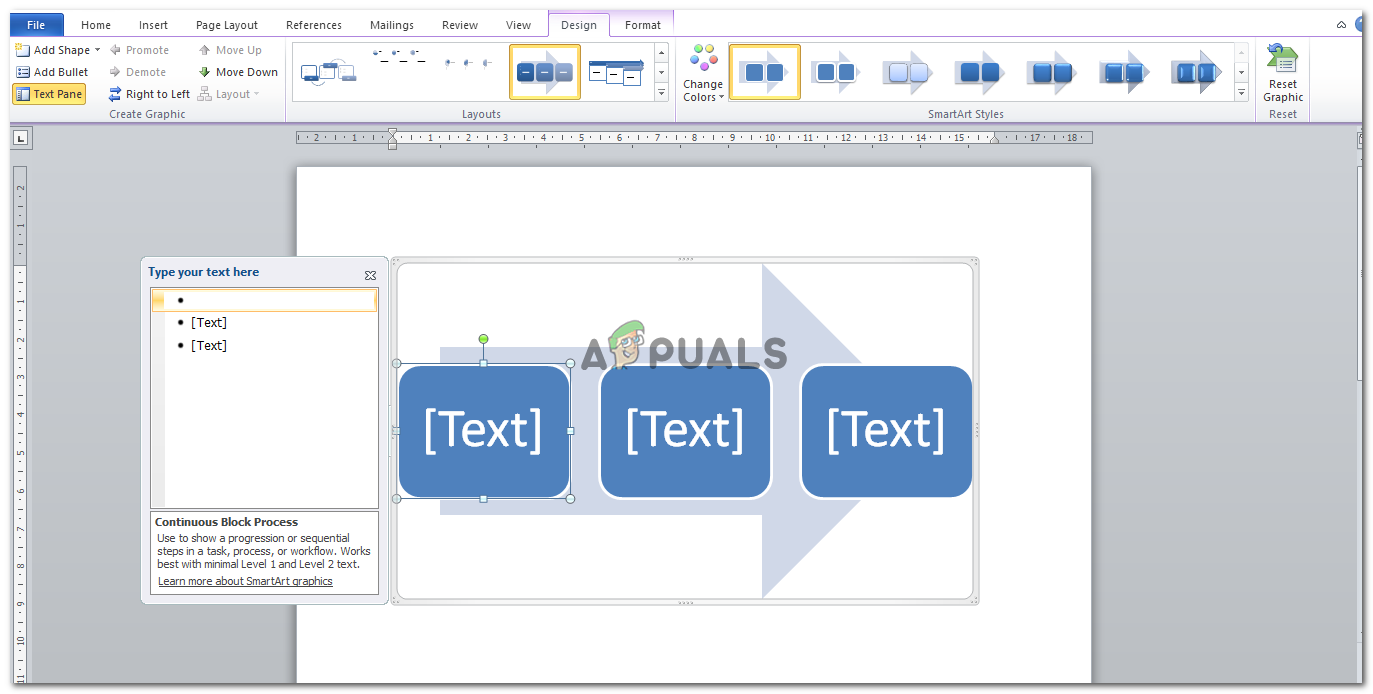
Your timeline graph is ready to be filled. - You can type the text in either of the two spaces that I have marked with the arrows. Either way it doesn’t make much difference. The text within the text box will adjust accordingly as you keep on adding words in it.
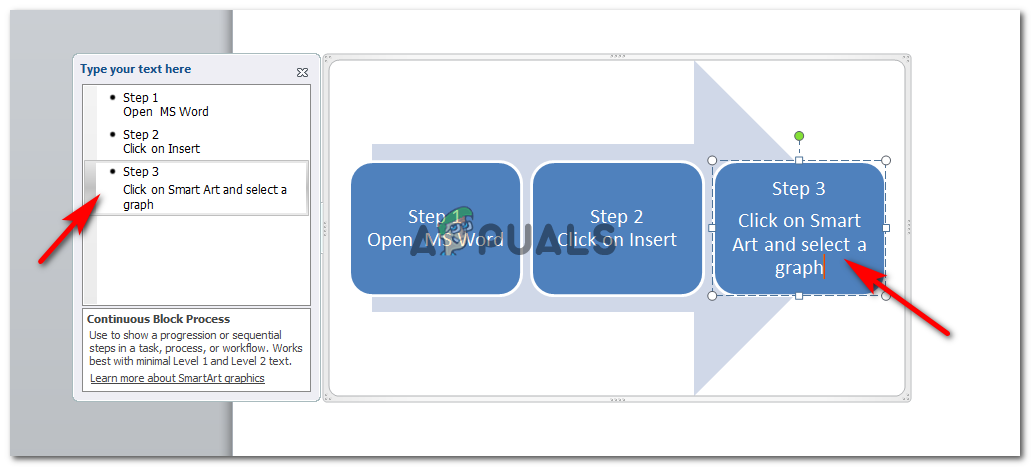
Add text to the boxes where [text] is written. The font size will automatically change according to the amount of text you add in. - You can change the color of your panels in the graphs or even change the color scheme of the graphs through design tools showing at the top of your screen. If you are not happy with the layout that you selected, you can also change it at any time.
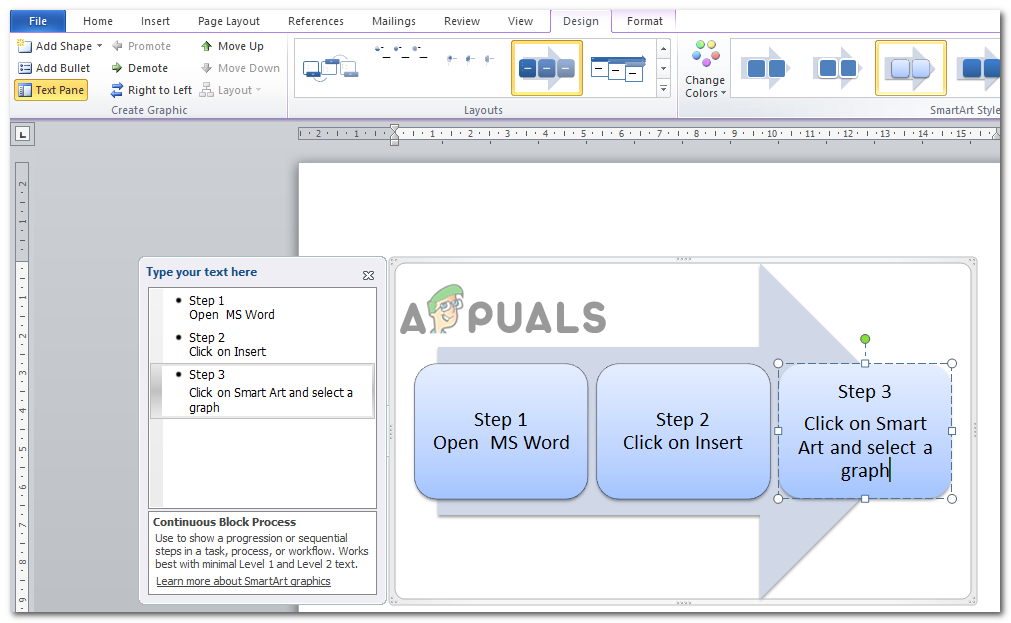
Change the design of your timeline. 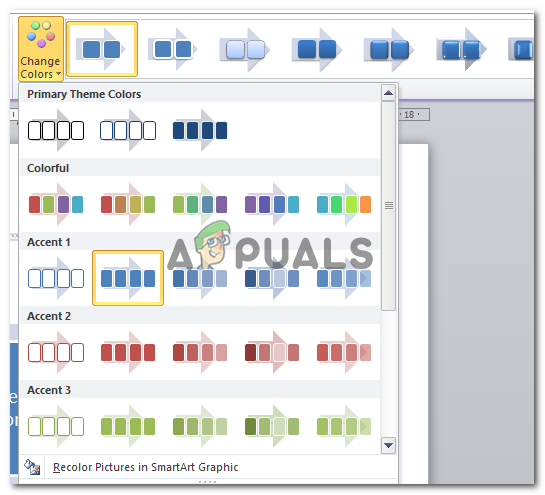
From Colors, to the style of your timeline, you can make any changes in the design. You can also change the layout by choosing a different style for your timeline. - The default setting of the graphs has a limited set of text boxes in which you can add text. But, with the help of ‘Add Shape’, you can add more text boxes to your graph. This way, you can make one timeline with as many steps/dates/events as you wish.
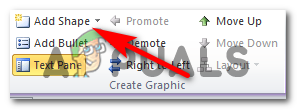
‘Add Shape’ adds another text box in your timeline. This gives you space to add more steps/periods/dates/events. - When I clicked on Add Shape, a shape was added automatically to the timeline, in the same color and formatting as the previous ones.
You can add as many shapes to your timeline. Just make sure your work does not look too stuffy. Either adjust your shape accordingly or your page size. - Did you know that you can also make one text box shape a part of another text box by clicking ‘Demote’? You can also shift the text boxes left and right with the help of ‘Right to Left’ tab as shown in the picture below.
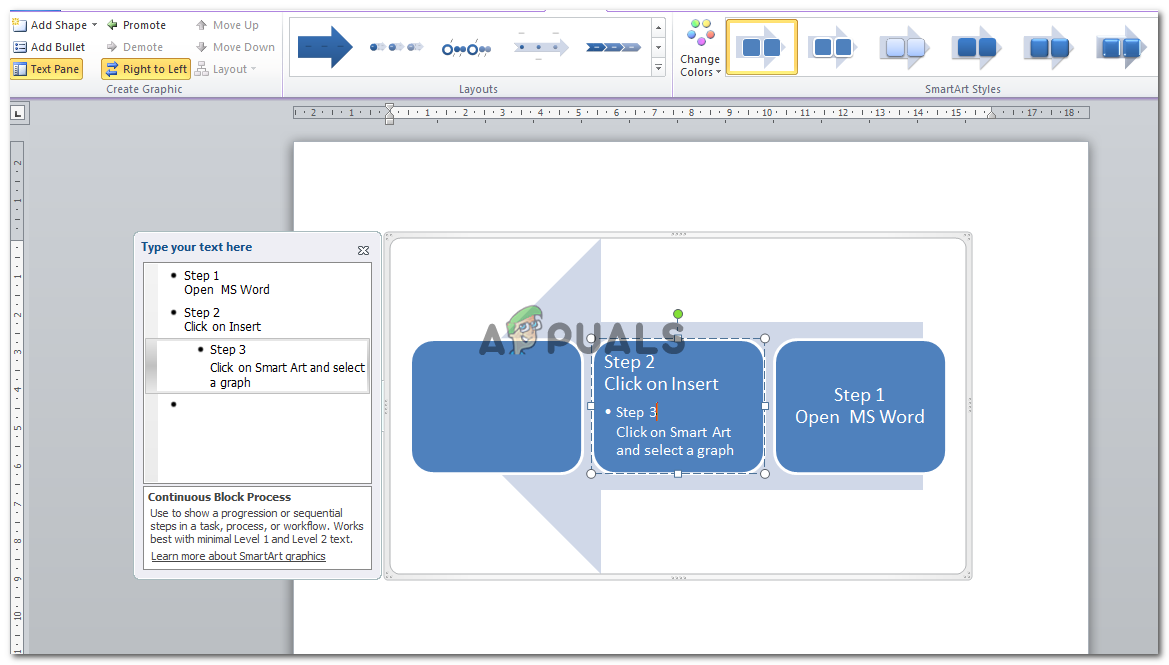
Make a text box a part of another one, or make two text boxes merge into one. - The option for ‘Format’ on the other hand is more about how you can alter the Outline of the shapes,the text within the shape and how you can change the shape. For instance, instead of a square, I can make it a triangle.
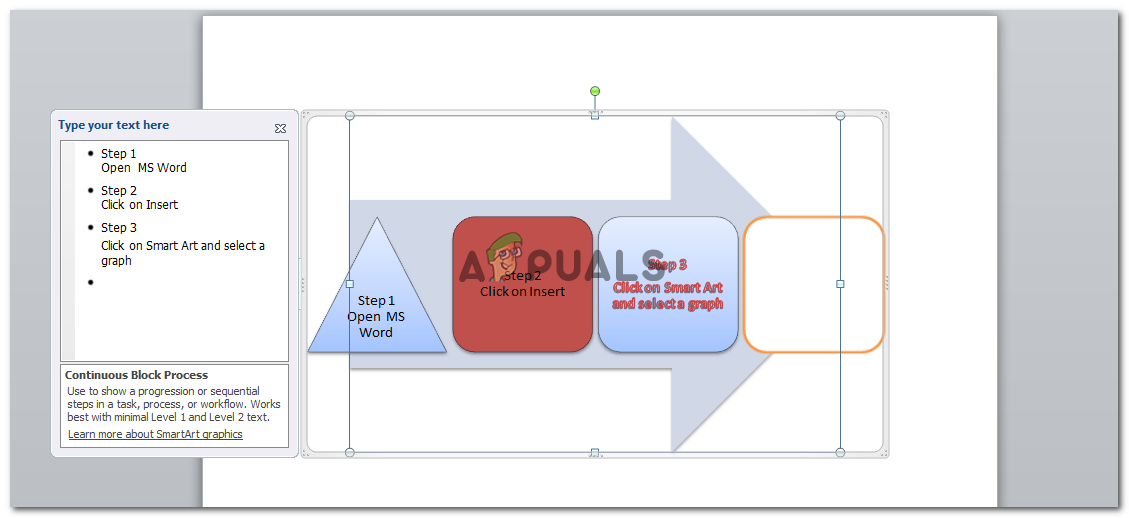
I changed the shape, the color of the shapes which are part of this timeline. I also added a border color and changed the formatting of text within the shape through the ‘Format’ tool 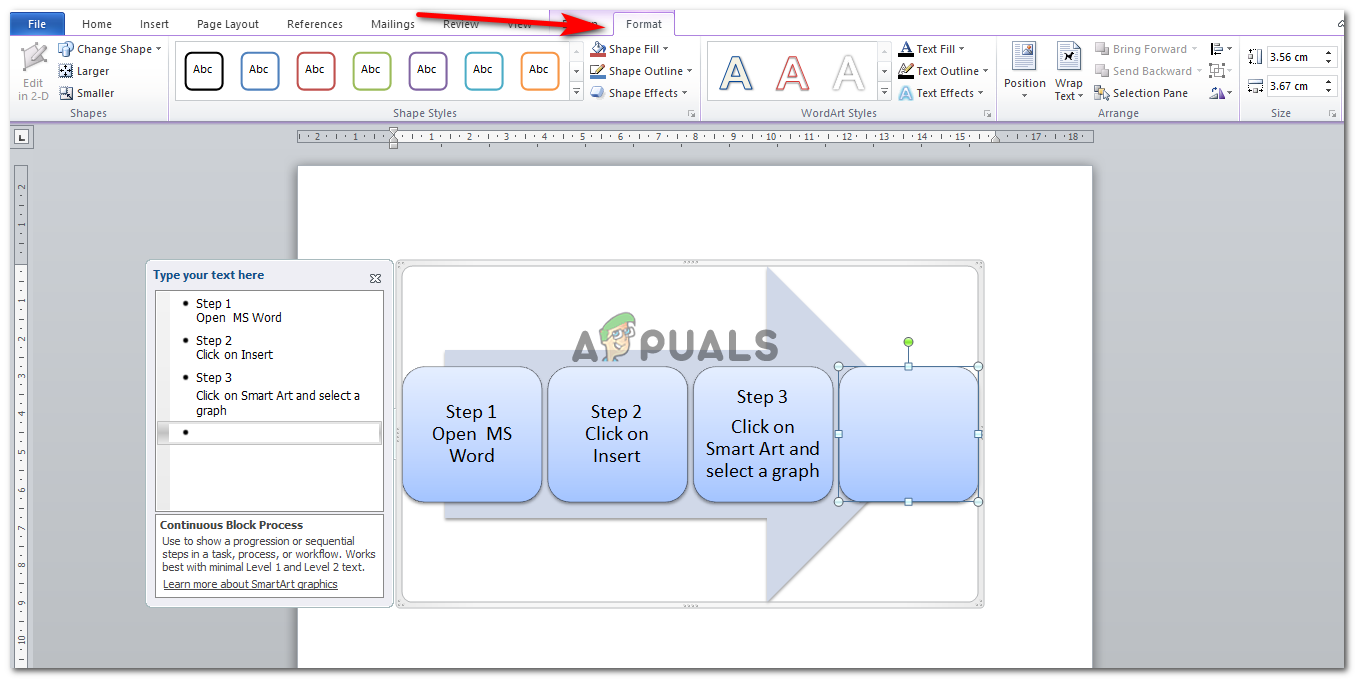
‘Format’ is a very important tab which appears once you have made the graph. It can be very helpful in making your graph look appealing. - MS Word gives you a free hand in editing your timeline, according to your requirements. You can change anything in the file even after you have saved it.
- If you don’t want to keep the changes that you just made, you can also undo everything with the help of this amazing too ‘Reset Graphic’ which will remove all the formatting that you just did and bring it all back to its original form.
Reset Graphic, a tab which you can use to undo any editing done to the Graph - I clicked this icon once and all the formatting that I had done, was removed. Keeping the timeline at its original formatting.
Undo the format changes that you made by using the Reset Graphics Tab


