How to Check CPU Temp on Windows
All kinds of people use computers on the daily – there are those who have no idea processors are even capable of overheating, those with overclocked processors who are constantly worried about the temperature of their CPUs, those with laptops who need to keep an eye on their processors’ temperature to make sure they don’t burn themselves if they decide to sit their computers down on their laps, and the average computer user who knows that CPUs can, in some cases overheat, and that it is therefore important to keep an eye on CPU temperature.
Unfortunately for Windows users, Windows does not have a built-in feature or utility capable of checking and displaying the temperature of your CPU. A feature or utility of this kind is absent even from Windows 10 – the latest and greatest version of the Windows Operating System. Thankfully, though, application developers have come to the rescue with a plethora of different programs for Windows 10 that are capable of not only monitoring and displaying the temperatures of each of your processor’s cores but , in most cases, a lot more.
You can only check your CPU temperature on Windows 10 using a third-party program, but there are a literal boatload of programs out there that you can use to do so. The following are the two best options you have when it comes to checking CPU temperature on Windows 10:
Option 1: Check CPU temperature using Core Temp
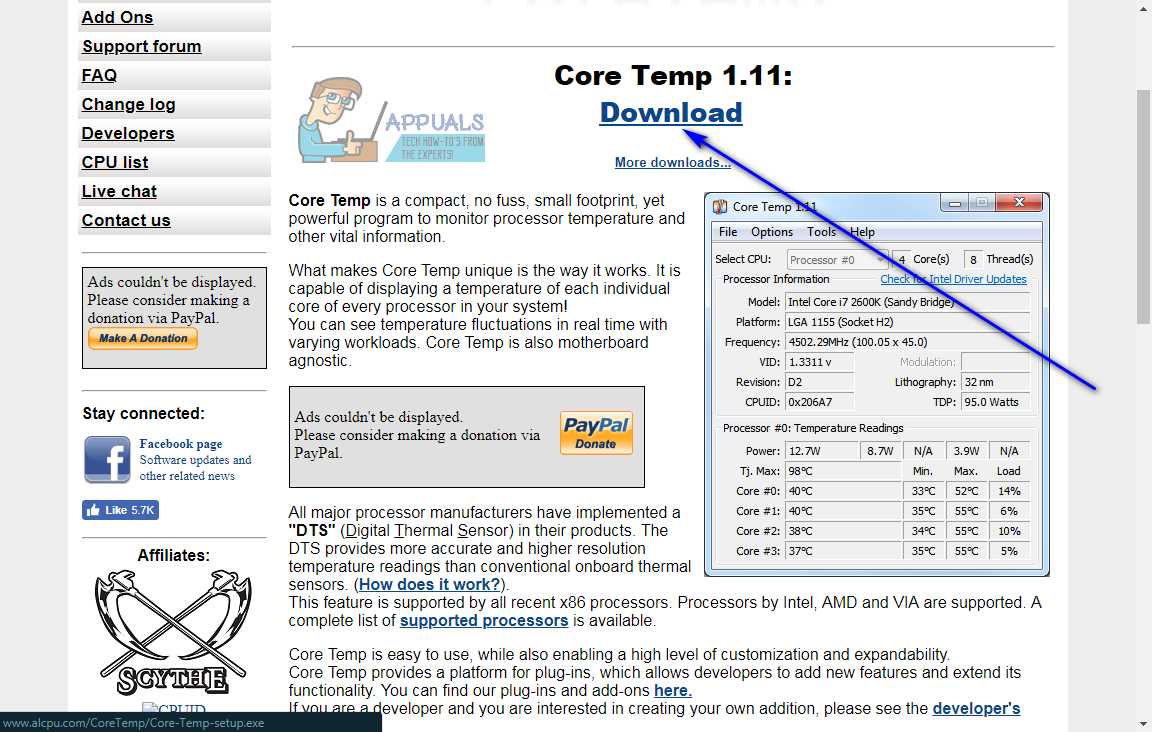
Core Temp is an extremely lightweight application that is compatible with Windows 10 and is capable of monitoring CPU temperature. Core Temp is a completely non-intrusive program as it simply runs in the background in your computer’s System Tray, keeping a check on the temperatures of each of your computer’s CPU’s cores. Core Temp is easy to use, really lightweight and, best of all, dedicated to only one function. Core Temp is also compatible with other popular third-party applications such as Rainmeter. If you would like to use Core Temp to monitor your Windows 10 computer’s CPU temperature, you need to:
- Go here and click on Download to begin downloading an installer for the latest version of Core Temp.
- Wait for the installer to be downloaded.
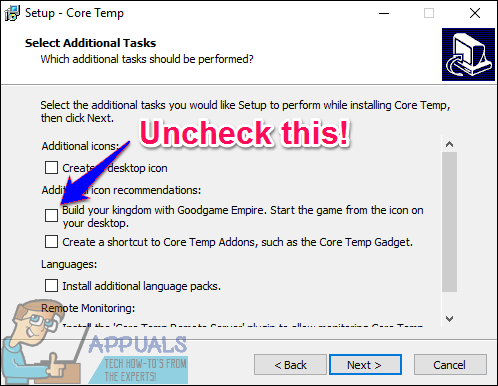
- Run the installer once it has been downloaded and follow the onscreen prompts and instructions to install Core Temp on your computer.
- On the third page of the installation wizard, be sure to uncheck any and all options to install any additional software.
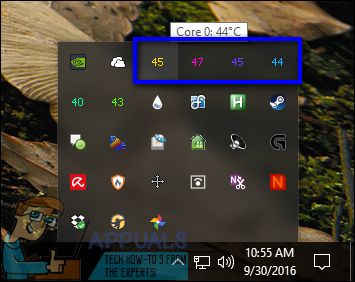
- Once Core Temp has been installed, run it. Core Temp will appear as a series of icons in your computer’s System Tray – one icon for one core of your processor, so there will be as many icons as your processor has cored. Each Core Temp icon will display the temperature of one core of your CPU – you can hover over an icon to find out which of your CPU’s cores’ temperature it is displaying, or right-click on a Core Temp icon to pull up the main window.
Core Temp‘s main window will display everything from the model of your CPU to the speed and temperature of each of its cores, as well as the Tj. Max value for your processor. A processor’s Tj. Max value is the maximum temperature (in Celsius) at which its manufacturer has rated it to be able to run on. A processor is considered to be overheating if it’s temperature is anywhere near its Tj. Max value, and the optimal temperature for a CPU is generally considered to be at least 10-20° lower than its Tj. Max value. 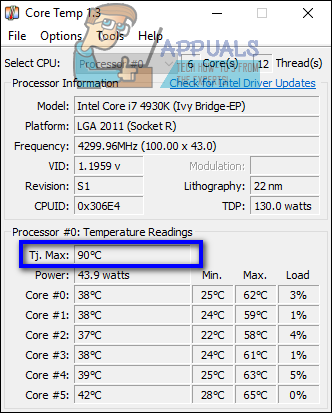
In the main Core Temp window, you can click on Options > Settings to play around with a few additional features the program has to offer. These additional features include the ability to run Core Temp as soon as you log in to Windows and the ability to customize how Core Temp icons are displayed in your computer’s Notification Area or System Tray. 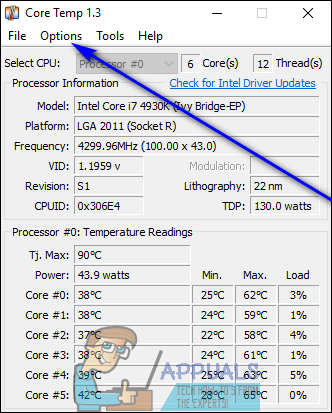
Option 2: Check CPU Temperature Using HWMonitor
If you would prefer being privy to a lot more information pertaining to your computer’s hardware than just the temperatures of your processor’s cores, you can opt to use HWMonitor. To use HWMonitor to keep an eye on the temperatures of all of your CPU’s cores, you need to:
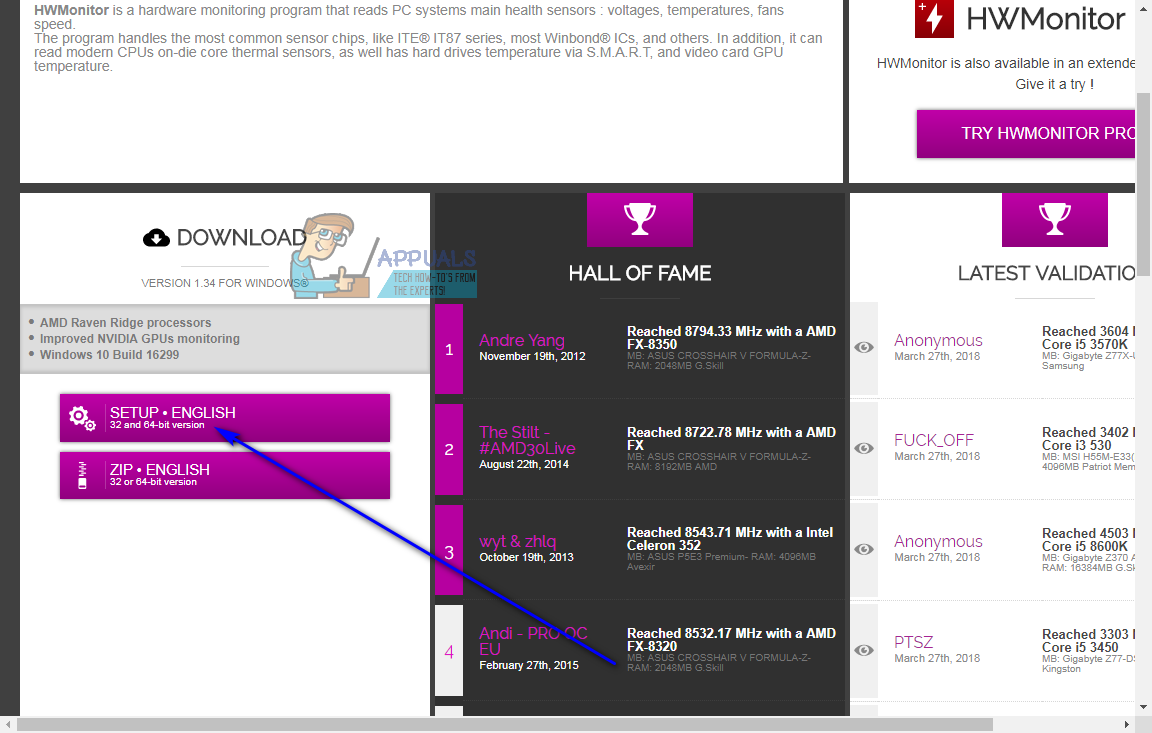
- Go here and download either the ZIP archive containing a portable version of HWMonitor that can simply be launched and doesn’t need to be installed, or the installer for HWMonitor.
- Simply launch HWMonitor if you downloaded the ZIP archive containing a portable version of the program, or, if you downloaded the installer for HWMonitor, install the program by running the installer and following the onscreen prompts and instructions and then launch it.
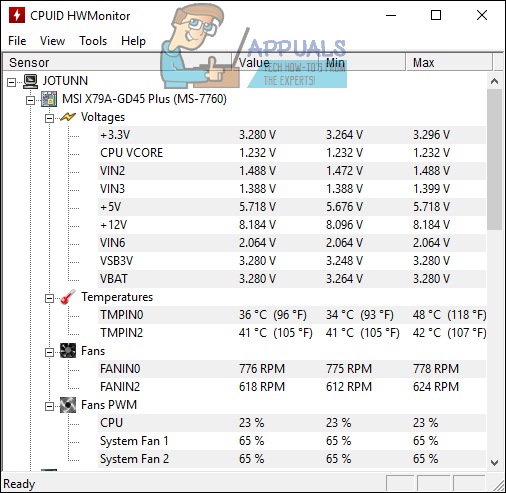
- When HWMonitor launches, you will see listings for everything from the voltages and speeds to the temperatures of most of your computer’s hardware. Scroll down to the section labeled as the name of your CPU – Intel Core i7 4930K, for example, and the temperatures for each of the cores of your CPU will be individually listed under Temperatures.
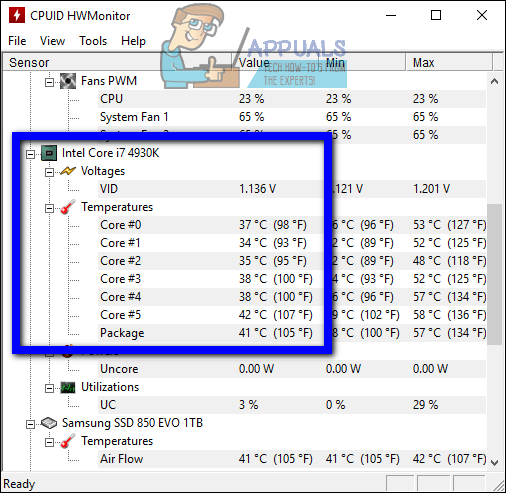
HWMonitor displays a lot more information regarding your computer’s hardware than just CPU temperature, which is what makes it a good program to have around. Go ahead and take a gander at the values for some of your computer’s other attributes, all of which can be monitored using HWMonitor.