How to Calculate Standard Error in Excel?
Microsoft Excel’s mathematical capabilities often go far beyond the needs of most everyday users. However, Excel’s built-in statistical functions make it an essential tool for anyone who works with data. One common task in statistics is to calculate the standard error, also known as the standard error of the mean (S.E.M).
Unlike many other built-in functions, Excel does not currently have a dedicated formula to calculate standard error directly. But don’t worry—this guide will walk you through it step by step, even if you have little technical background.
Definition and Importance of Standard Error
The standard error (S.E.) of a sample shows how close the sample mean is likely to be to the true average of the entire population, especially since working with the entire population is often not possible. Instead, we use samples. Standard error also helps you measure the spread and reliability of your sample results.
Standard Error Formula
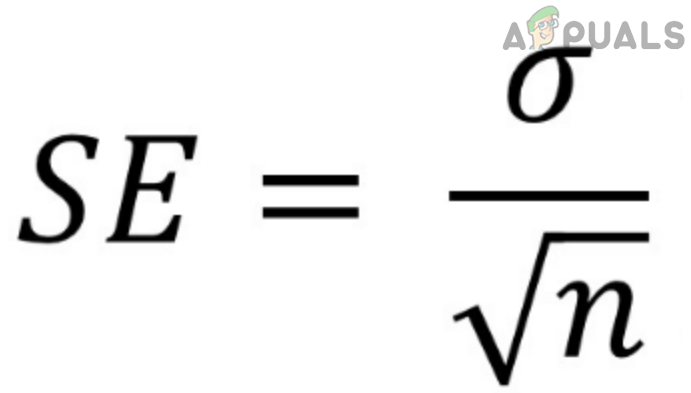
In statistics, the standard error is calculated as the standard deviation divided by the square root of your sample size:
Standard Error = Standard Deviation / √n
where *n* is the size of your sample.
Standard Error Formula in Excel
While many statisticians are familiar with the formula above, using Excel for automatic calculations can save time and improve accuracy. In Excel, you can use the following function to calculate the standard deviation of your sample:
STDEV(number1,number2)
Note: STDEV and STDEV.S both calculate the standard deviation for a sample. STDEV.P is used when you have data for an entire population.
To count your sample size in Excel, use:
COUNT(number1,number2)
And to find the square root of your sample size:
SQRT(COUNT(number1,number2))
Putting this together, your Excel formula for Standard Error becomes:
STDEV(number1,number2) / SQRT(COUNT(number1,number2))
For example, if your data is in cells B1 through G4:
STDEV(B1:G4) / SQRT(COUNT(B1:G4))
Calculating Standard Error In Excel
You can break down the process of calculating standard error in Excel into a few simple steps:
Prepare Your Sheet and Enter Your Data
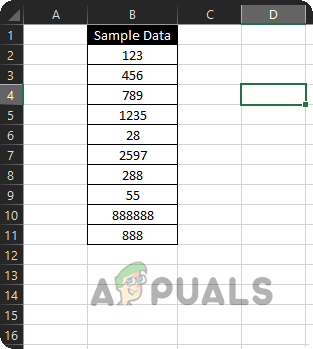
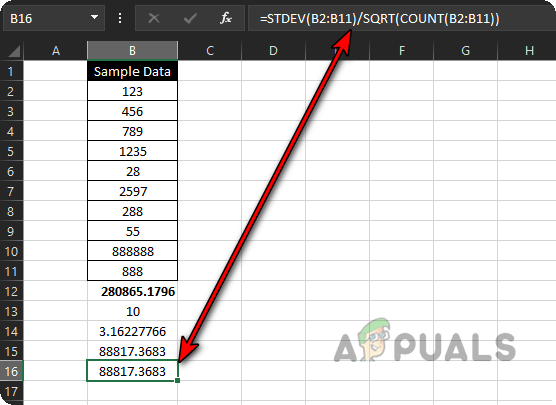
First, set up your Excel sheet and enter your data. It’s helpful to use clear labels as column headings. In the example image below, sample data is located from B2 to B11.
There are two main ways to calculate the standard error in Excel: by using separate formulas for each step, or by combining everything into a single formula. We’ll start with the step-by-step method to make things clear.
1.1. Calculate Standard Deviation
- Click on the B12 cell in your Excel sheet and type =.
- Next, enter STDEV( and select the range B2 to B11.
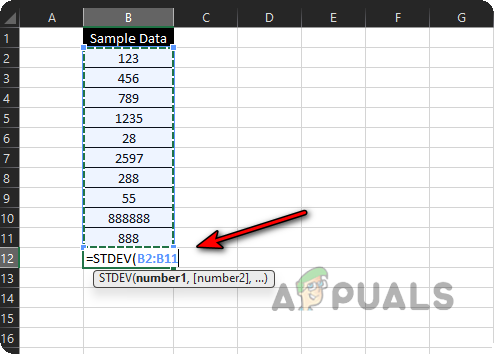
Enter Standard Deviation Formula in the Excel Sheet - Close the bracket ), then press Enter. Excel will now display the standard deviation for your sample.
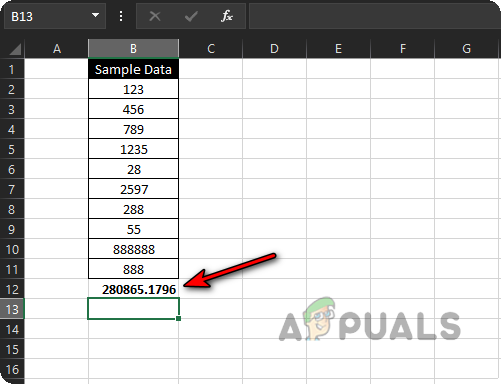
Standard Deviation of the Sample Data
1.1.1. Count the Sample Size
- Click in cell B13 and type =.
- Type COUNT( and select the range B2 to B11.
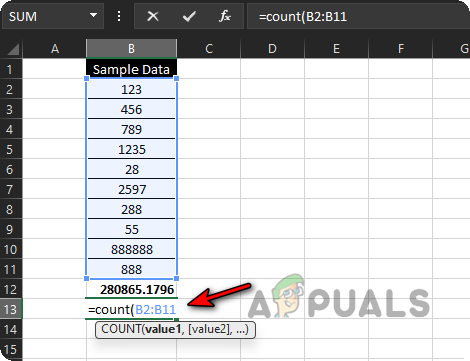
Count the Size of the Sample Data - Close the bracket and press Enter. You’ll now see the total number of data points in your sample.
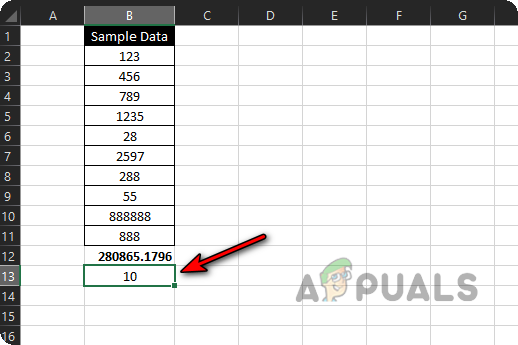
Calculated Size of the Sample Data
1.2. Calculate the Square Root of the Sample Size
- Click on B14 and type =.
- Enter SQRT( and click on cell B13 (where your sample size count is).
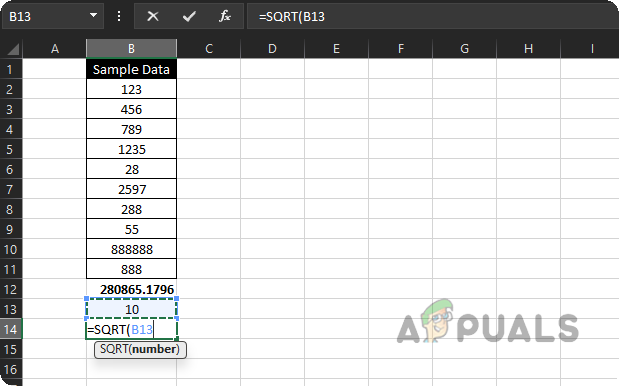
Calculate Square Root of the Size of the Sample Data - Close the bracket and press Enter. Now you’ll see the square root of your sample size.
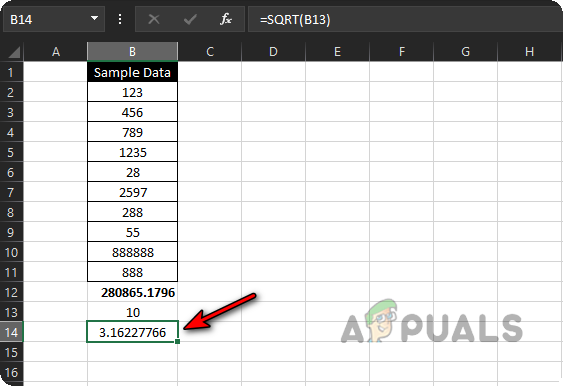
Calculated Square Root of the Size of the Sample Data
1.3. Calculate Standard Error
- Click on B15 and type =.
- Click on cell B12 (which holds the standard deviation), type /, then click on cell B14 (which holds the square root of your sample size). Press Enter.
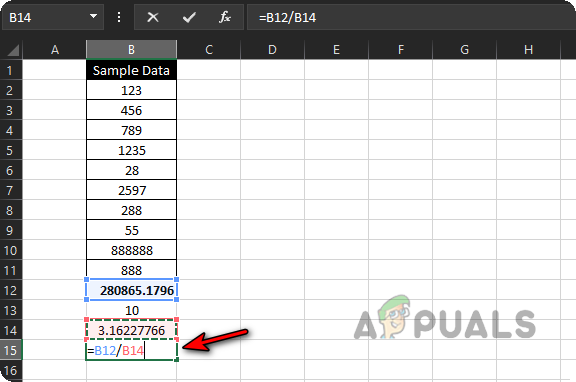
Calculate Standard Error of the Sample Data - Your standard error, calculated by Excel, will now be displayed.
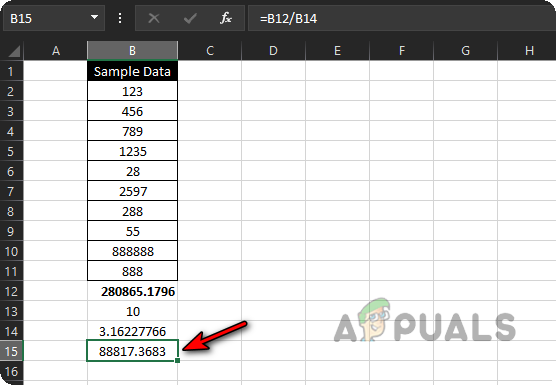
Calculated Standard Error of the Sample Data
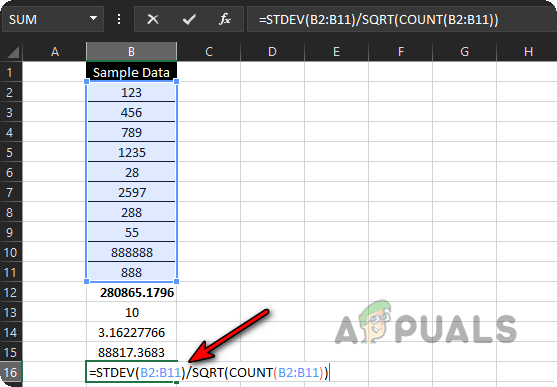
2. Use a Single Formula to Calculate Standard Error in Excel
If you prefer, you can skip the step-by-step method and use a single combined formula. Now that you understand each part.
- Click on cell B16 and type =.
- Enter STDEV( and select the range B2 to B11.
- Type ), then type /.
- Enter SQRT(COUNT( and again select B2 to B11.
- Close both brackets and press Enter. The full formula will look like this:
=STDEV(B2:B11)/SQRT(COUNT(B2:B11))
Calculate Standard Error of the Sample Data by Using a Single Formula - And that’s it—Excel will instantly show you the standard error using just one formula.
Calculated Standard Error of the Sample Data by Using a Single Formula - If you want to quickly calculate the standard error for other columns, just drag the formula from B16 to C16 or any other cell in your desired column. Excel will do the hard work for you!
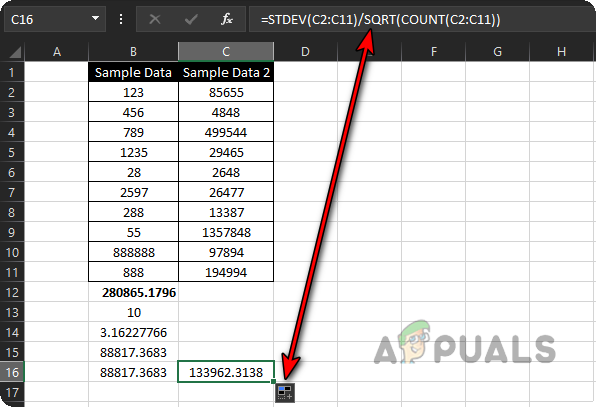
Drag the Standard Error Formula to C16 to Calculate Standard Error of C2 to C11
3. Use Analysis ToolPak to Calculate Standard Deviation and Count in Excel
You can also use Excel’s Analysis ToolPak add-in for a more automated approach to calculating standard deviation and count, which can then be used to calculate the standard error.
- Open Excel and go to the File menu.
- Click on More and then Options.
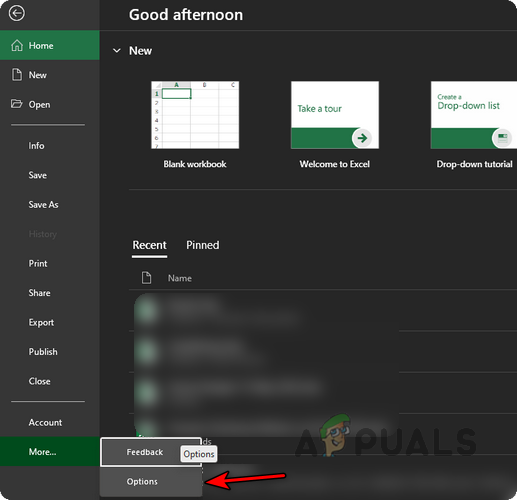
Open Excel Options in the File Menu - In the left-hand pane, select Add-ins. On the right, choose Analysis ToolPak.
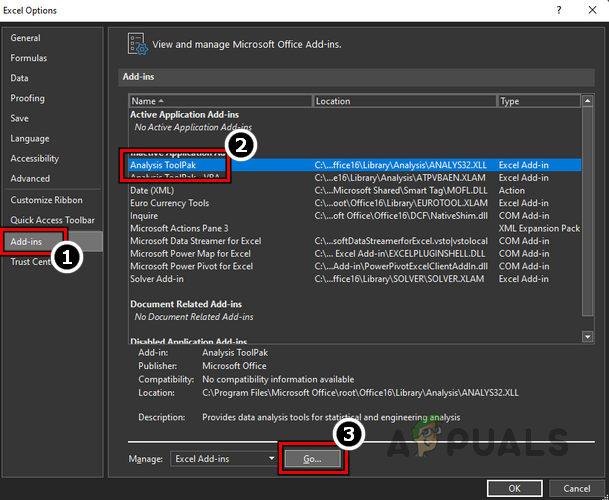
Select Analysis ToolPak in the Excel Add-ins and Click Go - At the bottom, click Go. In the pop-up, check the box for Analysis ToolPak.

Install Analysis ToolPak Add-in in Excel - Click OK and wait until the add-in is installed.
- Then, open your sample data sheet as discussed earlier and go to the Data tab.
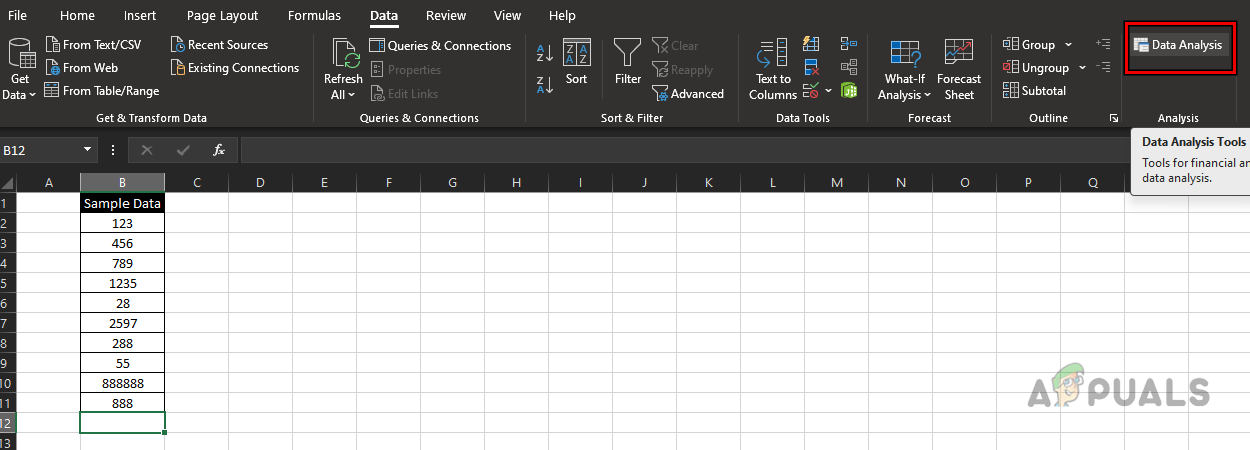
Open Data Analysis in the Data Tab of Excel - Next, click Data Analysis, select Descriptive Statistics, and then click OK.
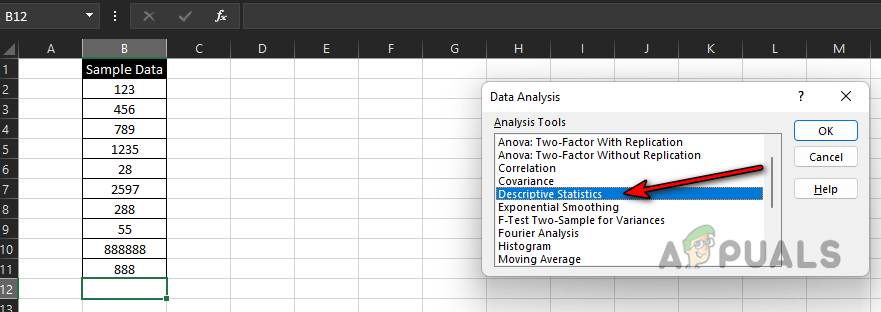
Select Descriptive Statistics in Excel’s Data Analysis - Select the range B1 to B11 (B1 is your label) as the Input Range and choose the Columns radio button.
- Tick the Labels in First Row box and also check Summary statistics.
- Select the Output Range radio button and choose a location like D2 to F20.
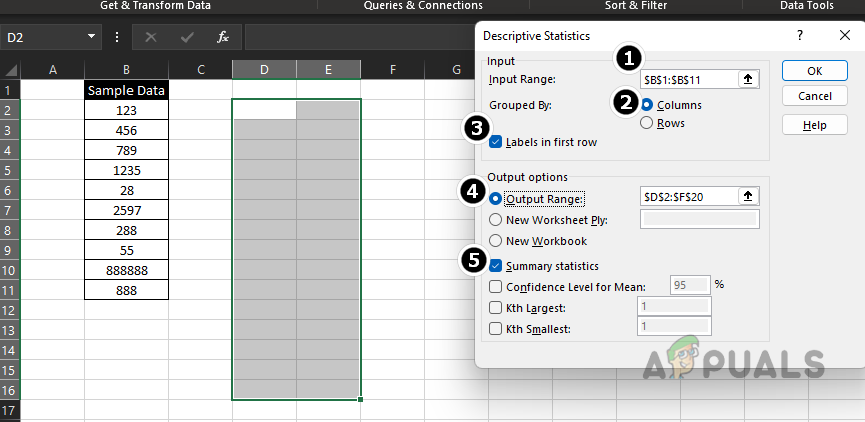
Use Descriptive Statistics to Calculate Standard Deviation and Count of the Sample Data - Click OK. In the summary output, you will find both the standard deviation and the count.
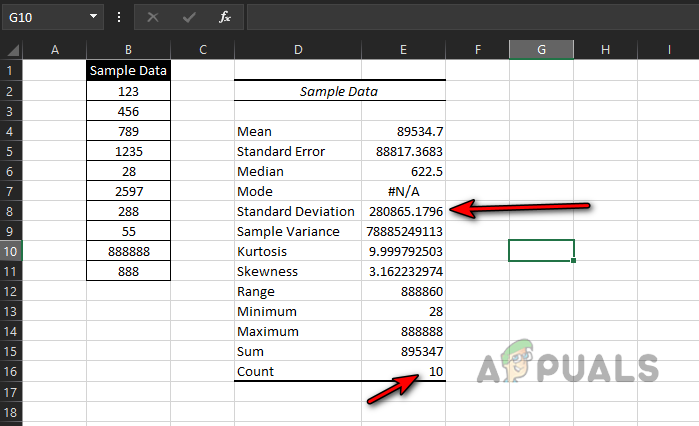
Use Descriptive Statistics to Calculate Standard Deviation and Count of the Sample Data - You can now calculate the standard error using these two values.
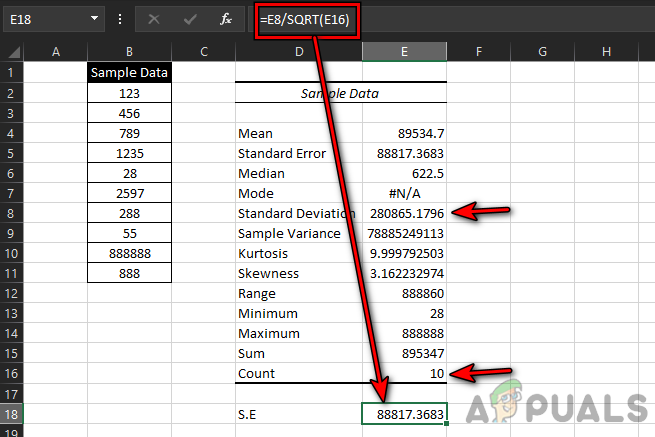
Calculated Standard Error of the Sample Data Through the Excel’s Analysis ToolPak
If you have any questions about calculating standard error in Excel, please feel free to ask in the comments below!