How to View Traffic and Other Details of your Routers and Switches in Real-Time?
No matter how you look at it, there exists a network almost everywhere. This is, without a doubt, due to the sheer development in the technologies that are available on the internet. We can all agree on the fact that networks have become way more tangled and the recent developments have certainly been a reason for that. Other than that, one cannot simply ignore the utter number of devices that are now able to exist on the internet, a courtesy of the Internet of Things or IoT.
With that, the traffic on your network devices which includes your routers and switches is certainly bound to increase. As you involve more and more devices to your network, the harder it becomes to manage it overall as there’s a whole bunch of data that needs looking after. Therefore, the manual way of doing things becomes obsolete and is out of the picture. Fortunately, there are tons of network tools and utilities available now that you can find a tool for almost any networking task.
In order to be able to uphold an optimum network, you will have to keep an eye on your network on many different levels. This includes the devices that provide connectivity to the other devices in your network. Being aware of the traffic and other statistics like port configuration and more can be really helpful as one, it helps you in identifying any unauthorized devices in your network as well as troubleshoot any issues should they occur. Therefore, monitoring takes an important role when it comes down to managing a network.
Downloading the Real-Time Interface Monitor
As you are probably already aware, you can find a bunch of tools that lets you monitor the statistics of your routers and switches. The amount is so high that newcomers often have to go through a hard and boring time of finding the right tool. Finding the right software tools shouldn’t be hard, which is also the motto of the company whose product we are going to use today.
Solarwinds Engineers Toolset (download here) is a network software that packs a whole bunch of features and tools which make your tasks way more fun and easier. The product comes with over 60 tools that can be utilized in different network fields, from troubleshooting to discovering your network, from monitoring your network in real-time to receiving alerts, there’s something present in the toolset that you can use almost anywhere.
We will be using the toolset in this guide so make sure to go ahead and download the tool. You can use the evaluation period provided by Solarwinds to download the tool and assess the product for yourself. Once you have downloaded the tool, install it on one of the systems in your network and then just follow through the article for further instructions.
What is the Real-Time Interface Monitor Tool?
Solarwinds Engineers Toolset comes packed with the Real-Time Interface Monitor tool that continuously displays statistics from your routers and switches. The tool comes with over 30 statistics grouping that include more than 400 standard and proprietary statistics. These include traffic details, ethernet/port configuration, details of error messages, status of different interfaces and ports, ARP cache along with many more.
We will be making use of this tool from the Engineers Toolset in this guide today.
Viewing Real-Time Details of Routers and Switches
With all of that being said, we can finally proceed with showing you how to view the different statistics regarding your routers and switches. Thanks to the Real-time interface monitor tool, this is very easy to do. For real-time monitoring, you need an SNMP community string so make sure you have that with yourself as you will be needing it while adding a device to the tool. Here’s how to add a device to the Real-Time Interface Monitor tool:
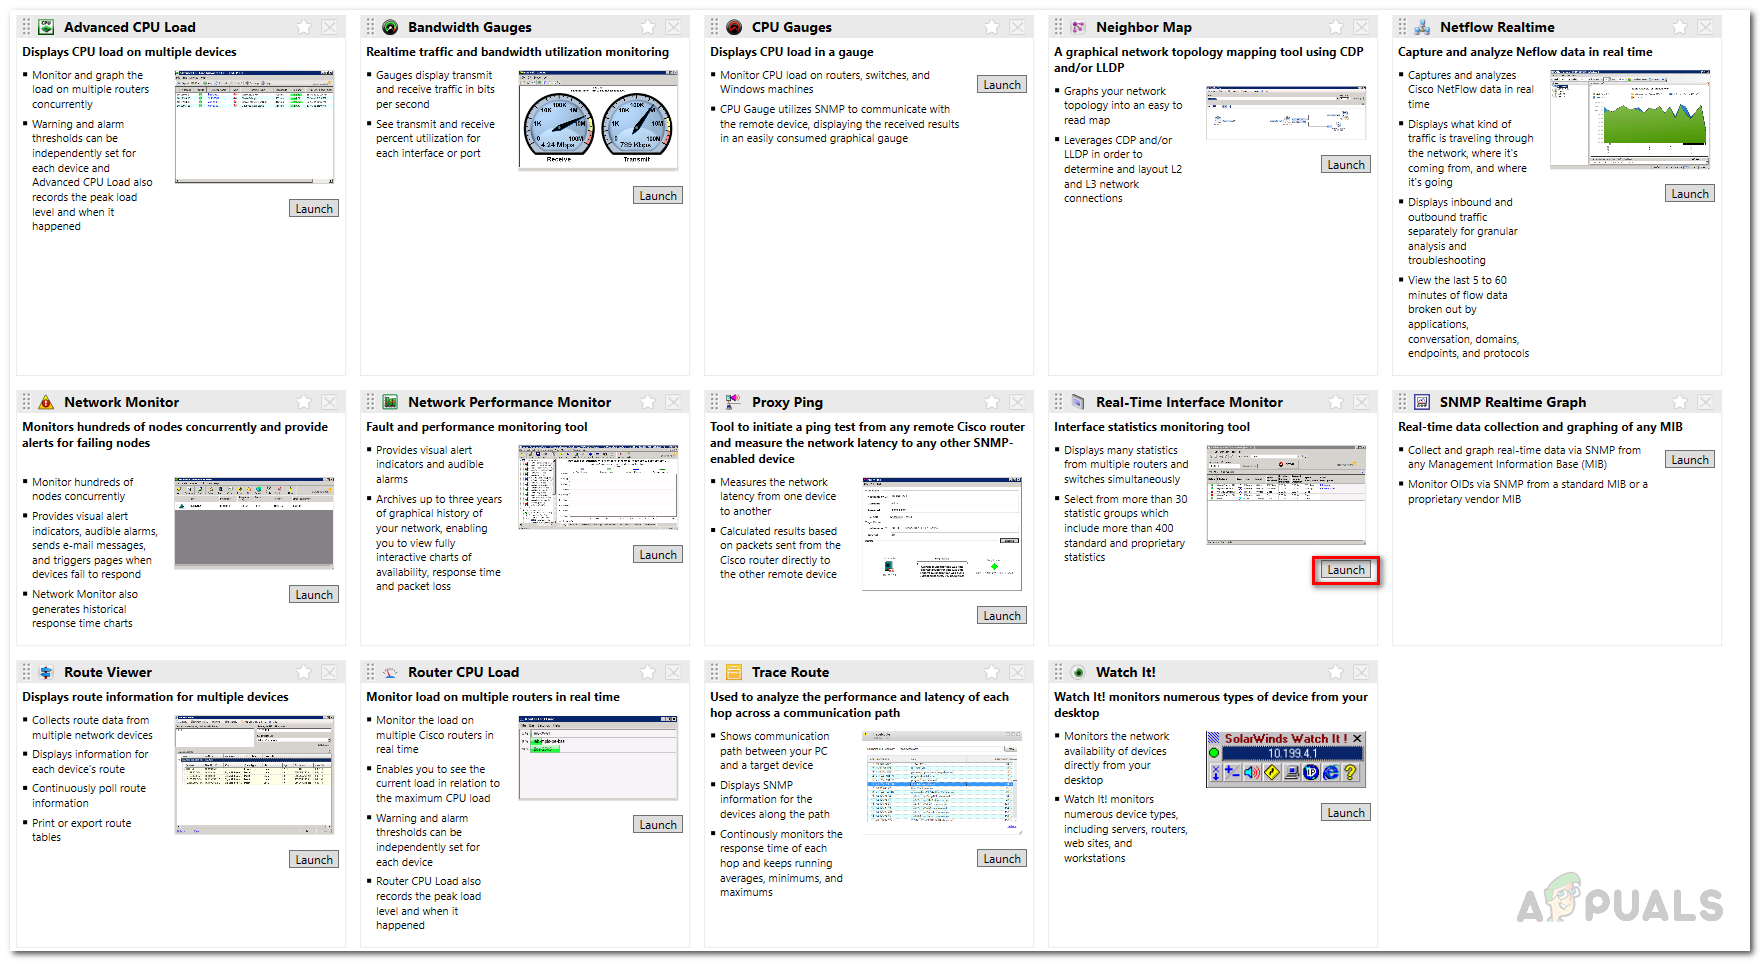
- First of all, open up the Engineers Toolset by opening up the Start Menu and searching for the Toolset Launchpad.
- After that, in the search bar provided, type in Real-Time Interface Monitor and then press Enter or click on the result shown. After that, click on the Launch button for Real-Time Interface Monitor. Alternatively, you can just go to the Network Monitoring section on the left-hand side and then click the Launch button for the said tool.
Network Monitoring Tools - If you have installed the Orion version of the tool, you can also access the Real-Time Interface Monitor from the Orion web console. This enables remote access to the tool which can really be helpful in a large network when you have to be punctual or if different users have to use the tool.
- To access the web console, in a web browser, type in the IPAddressorHostname:port. The default port is 8787 so it should look something like IPAddressorHostname:8787. The web console version of the tool follows the similar instructions with the buttons being a bit differently phrased. The tools can be accessed by going to My Dashboard > Toolset.
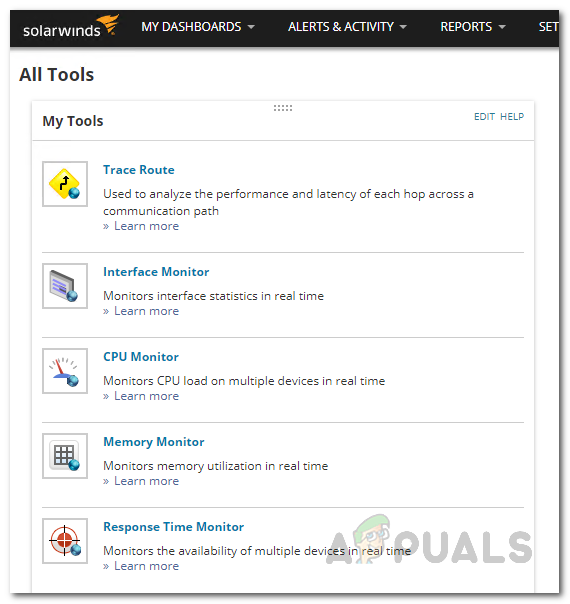
Engineers Toolset Tools on the Web Console - Once the tool has opened up, click on the Select Device option. On the web console, you will have to click the Add Non–Orion Device.
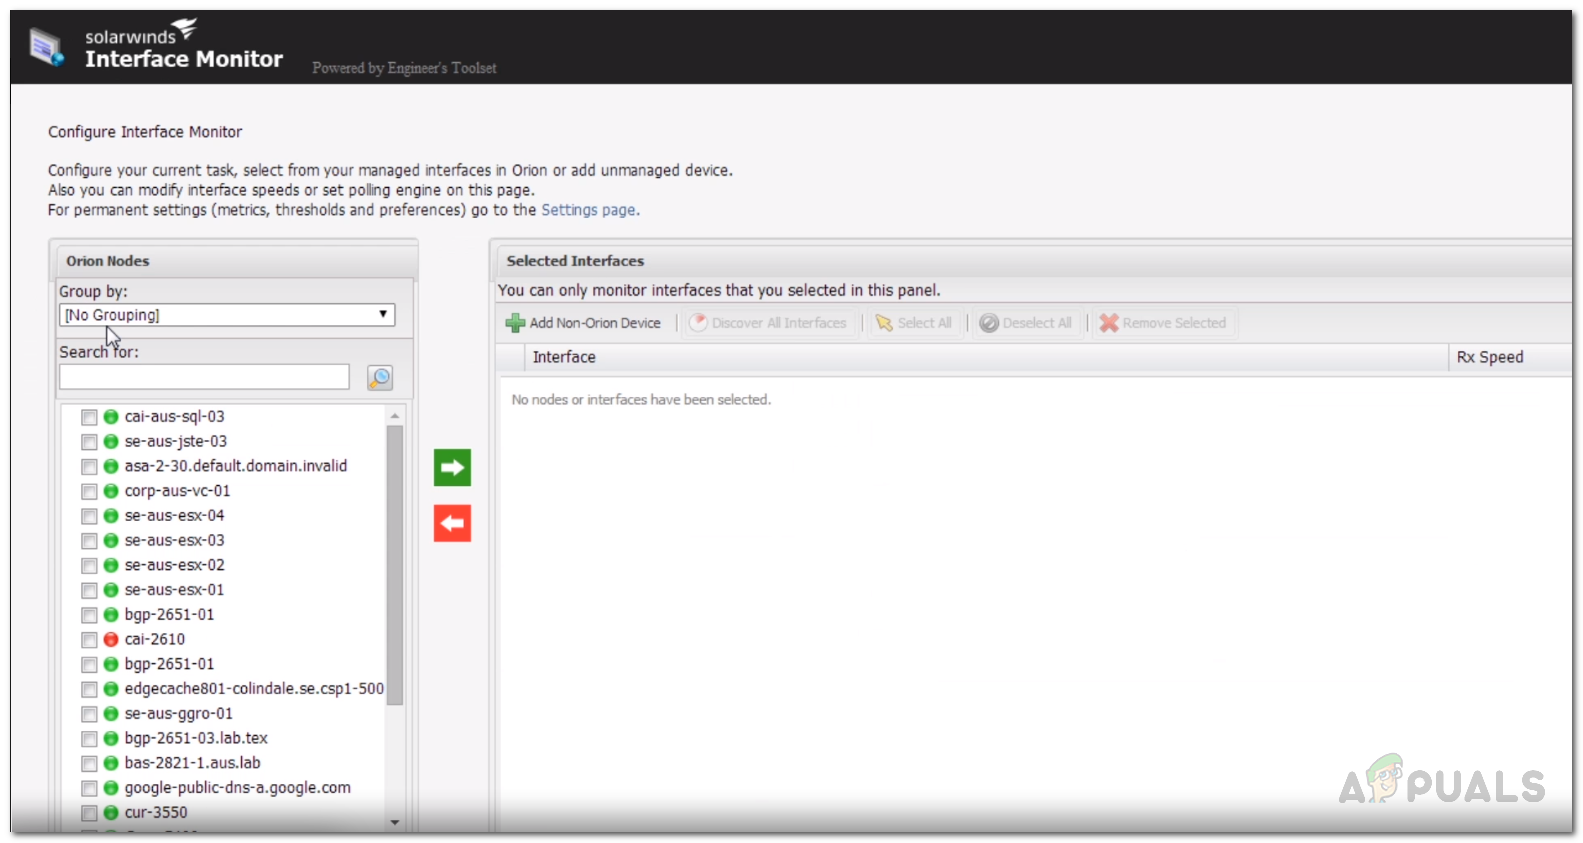
Adding Device using Web Console - Provide the device credentials in the new window that pops up and then hit the OK button.
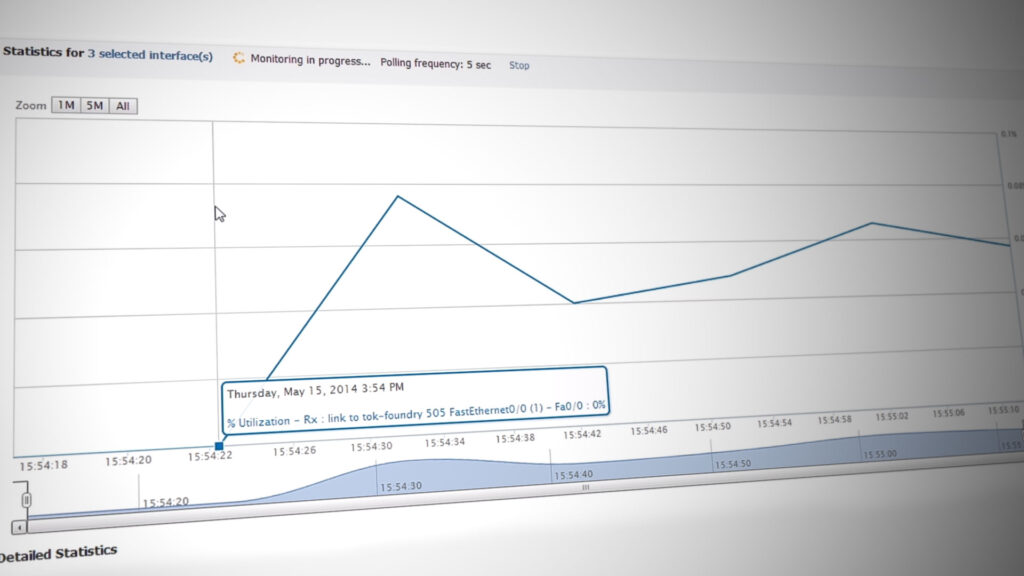
- With that done, click on the Monitor button to start monitoring the device.
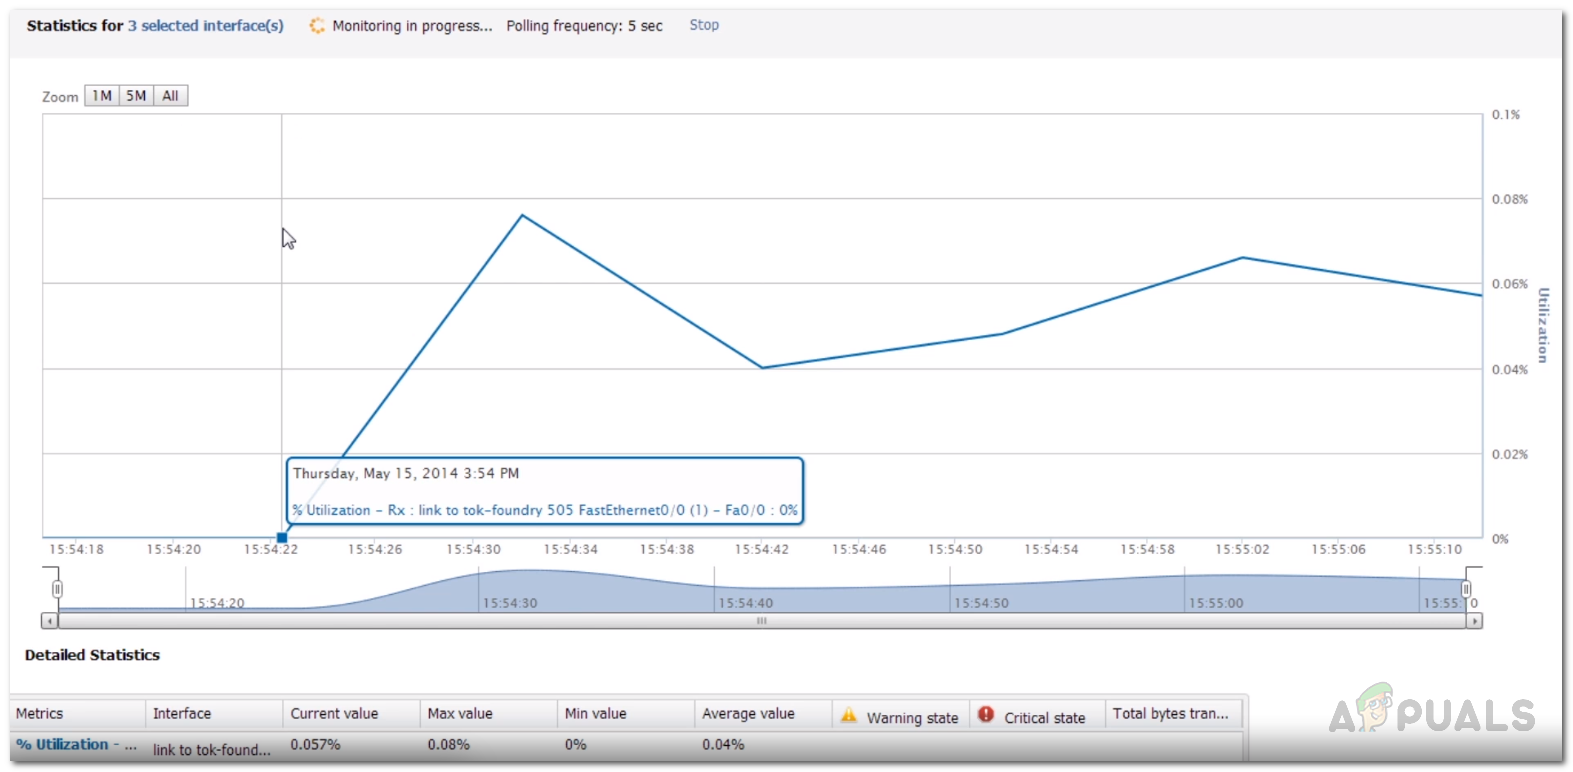
Real-Time Interface Monitor - You can view any statistics you want by selecting them from the Statistics Group list.
- If you wish, you can shorten the statistics update interval from the settings. To do this, just click on the File option in the menu bar and then go to Settings.
- After that, in the General tab, move the Statistics Update Interval slider per your needs to change the update interval.
- Once done, click the OK button to save the changes.
- Other than that, you can also choose to export or print any statistics you wish. For this, just click on the File option and then select Export or Print respectively.